research

Four studies, built to be falsifiable.

Each one starts with a question a desk would actually ask, ends with a number that could have come back negative, and several did. The interesting part is usually what survived the costs.

market microstructure

C++ · simulation

Market Making & Adverse Selection Strategy

  • Designed a C++ limit order book market maker providing continuous two-sided liquidity around fair value, simulating fills and spread capture.
  • Implemented inventory-aware quoting with volatility-adaptive spreads, skewing prices and sizes using microprice and order-flow-imbalance signals to control directional exposure and inventory risk.
  • Benchmarked fixed, inventory-aware, and signal-driven quoting across 100,000+ simulated fills, using 10-second markouts and inventory variance to quantify the adverse-selection tradeoff.
languageC++
venue modelSimulated limit order book
signalsMicroprice, order-flow imbalance
diagnostic10s markouts, inventory variance
sample100,000+ fills
derivatives

Python · listed options

Options Pricing & Volatility Surface Engine

  • Programmed a Python derivatives pricing engine with Black-Scholes, binomial tree, and Monte Carlo simulation, cross-validating outputs across US equity options to verify convergence and pricing consistency.
  • Constructed implied-volatility surfaces from listed option chains across 10 US equities, mapping strike and maturity to reveal volatility smiles, skew, and term-structure dynamics.
  • Simulated delta-hedged short volatility positions over 5 years, comparing daily versus weekly rebalancing under transaction costs to quantify P&L variance and hedging cost tradeoffs.
modelsBlack-Scholes, binomial, Monte Carlo
surfaceSmile, skew, term structure
universe10 US equity chains
hedging test5 years, daily vs weekly
frictionsTransaction costs included
statistical arbitrage

Python · cross-asset futures

Cross-Asset Futures Relative Value & Statistical Arbitrage

  • Researched 40 economically linked futures spreads across equity-index, fixed-income, and commodity markets, applying liquidity filters and cointegration tests where 8 survived Benjamini-Hochberg correction.
  • Modeled mean-reverting spreads with Ornstein-Uhlenbeck time-series models, estimated a 20-day median half-life, and walk-forward tested hedge ratios, with rolling OLS outperforming Kalman filtering out of sample.
  • Converted statistical spread signals into margin-aware futures positions, filtering trades by half-life and expected convergence, leaving 3 profitable out of sample after costs.
universe40 spreads · equity, rates, commodity
multiple testingBenjamini-Hochberg → 8 survive
mean reversionOU, 20-day median half-life
hedge ratioRolling OLS beat Kalman
after costs3 profitable out of sample
systematic platform

Python · FastAPI · cloud

AI-Powered Systematic Trading & Research Platform

  • Architected a production-grade, cloud-deployed Python quantitative platform with scalable FastAPI services, spanning 9 market data and fundamentals providers across the full systematic investing workflow through broker-connected execution.
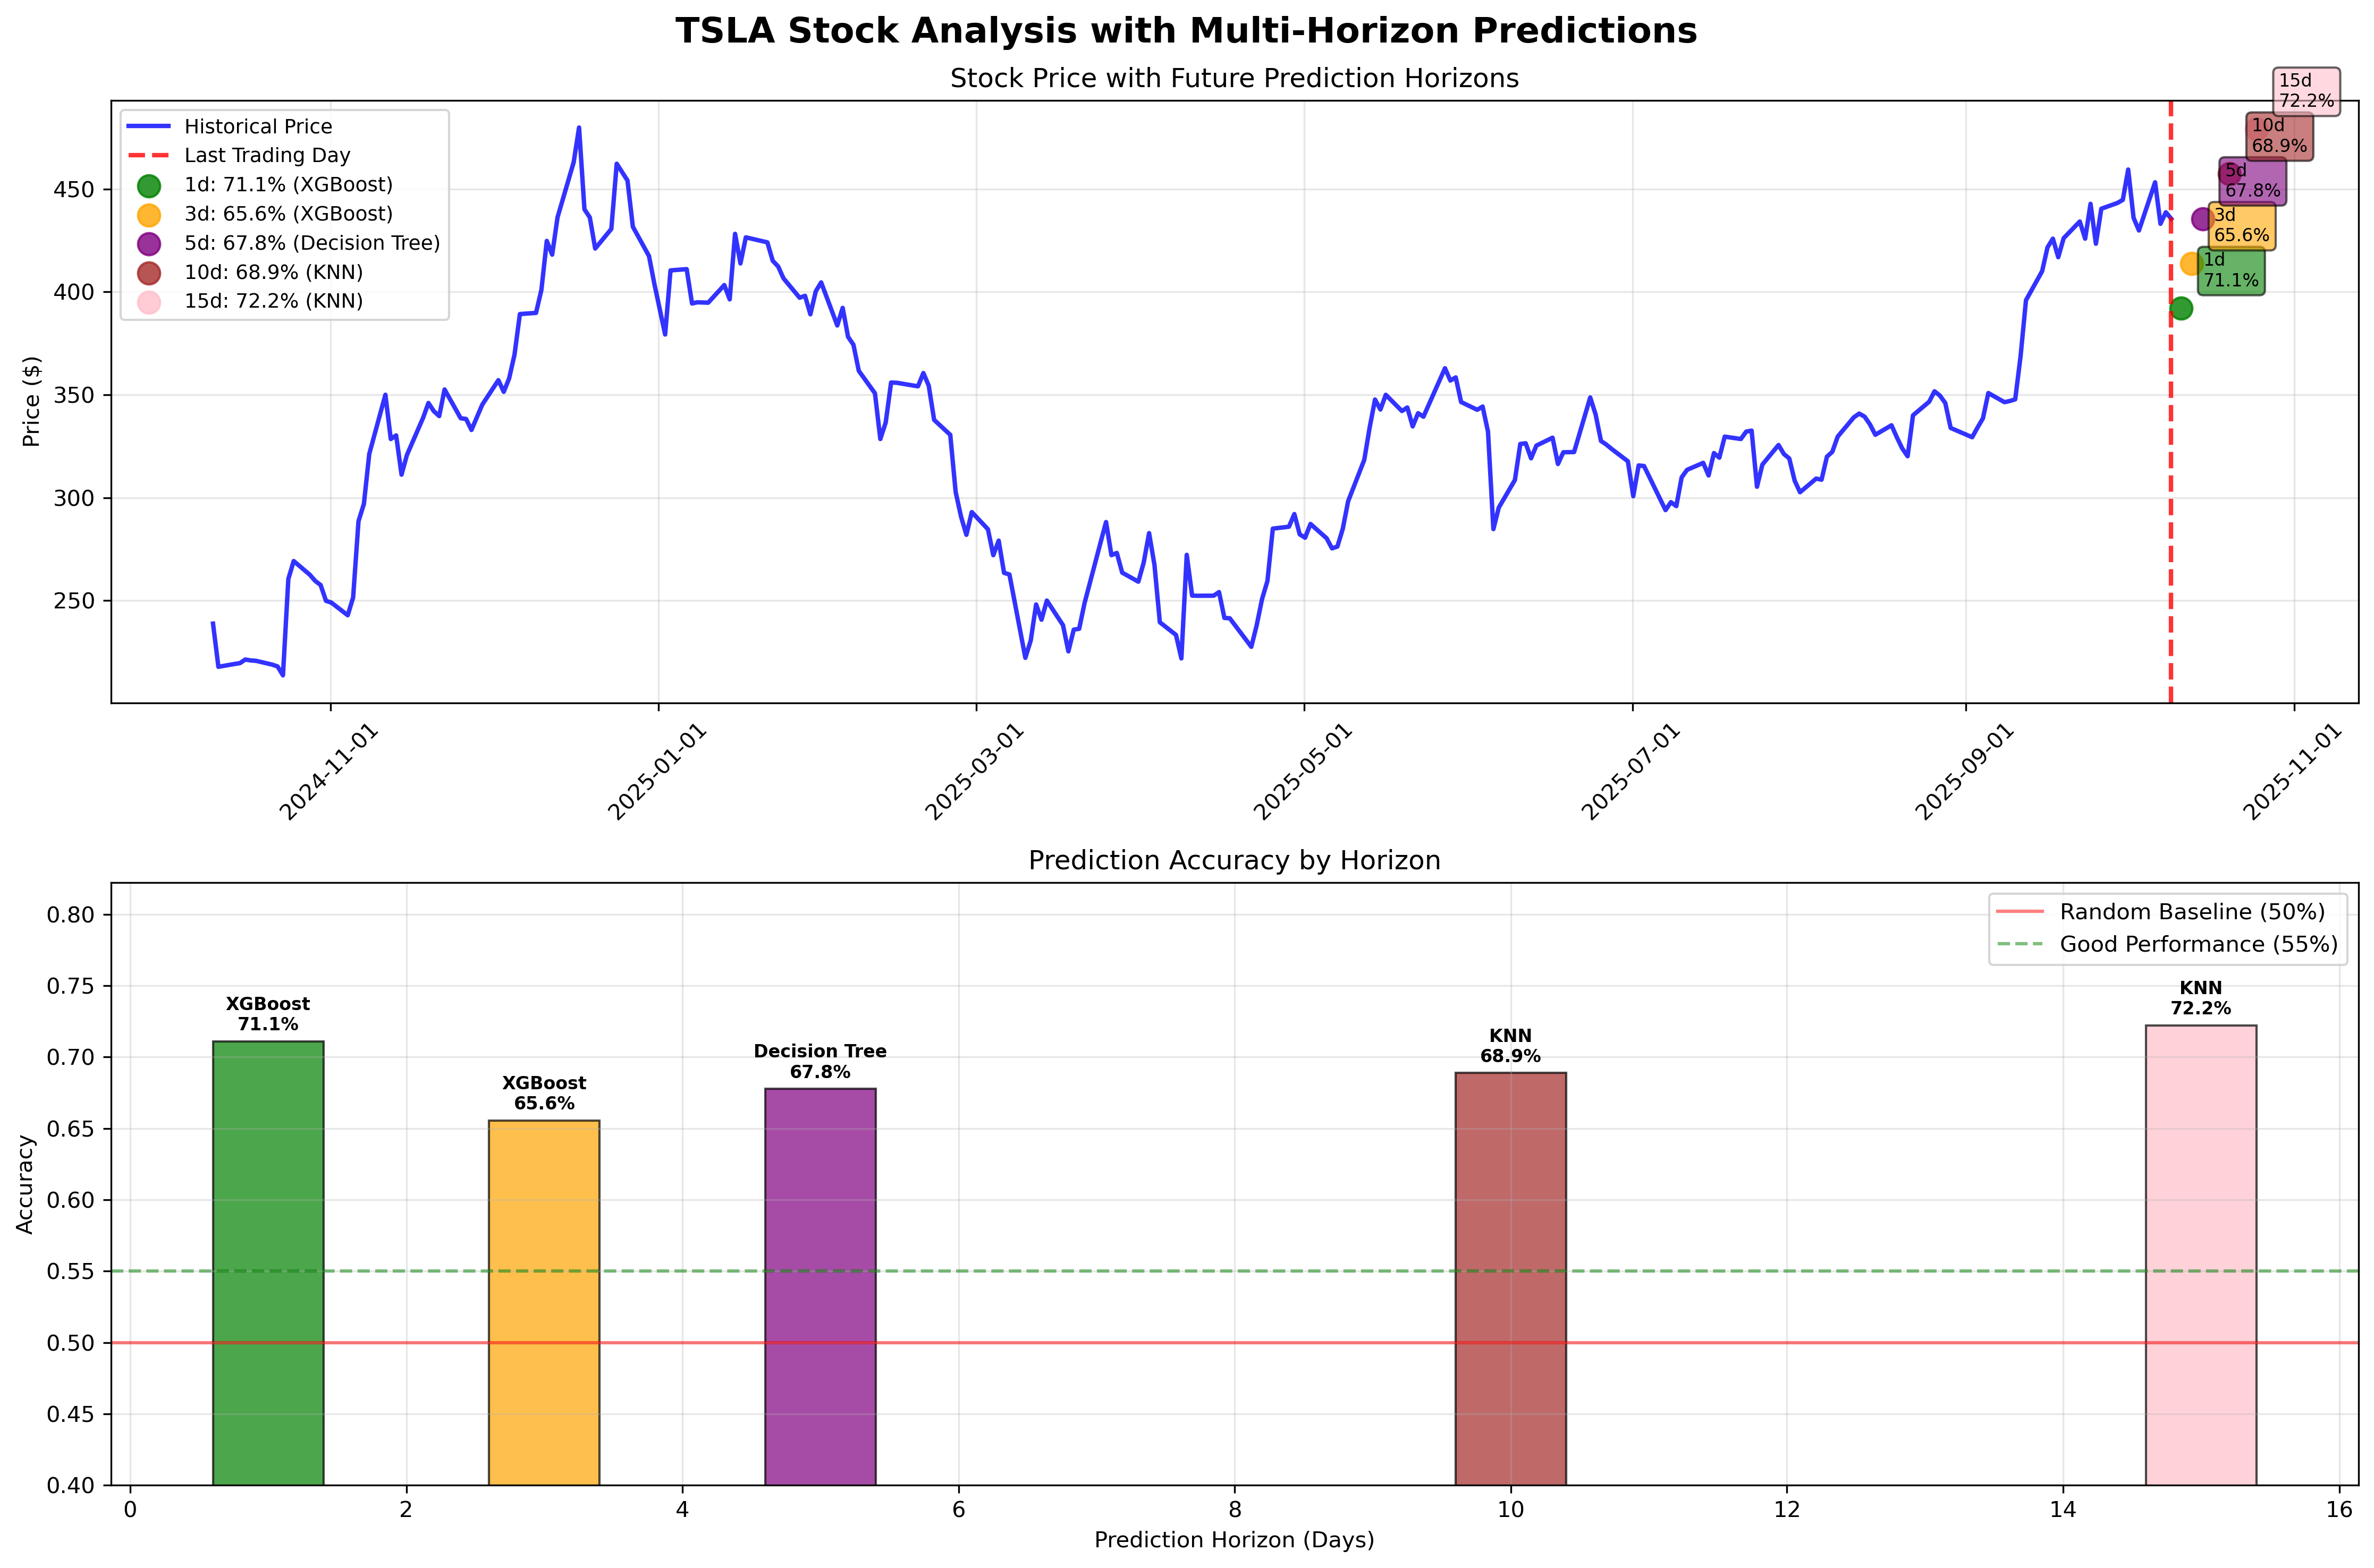
  • Engineered a machine learning pipeline and model library with TradingView integration, turning saved models into a reproducible workbench.
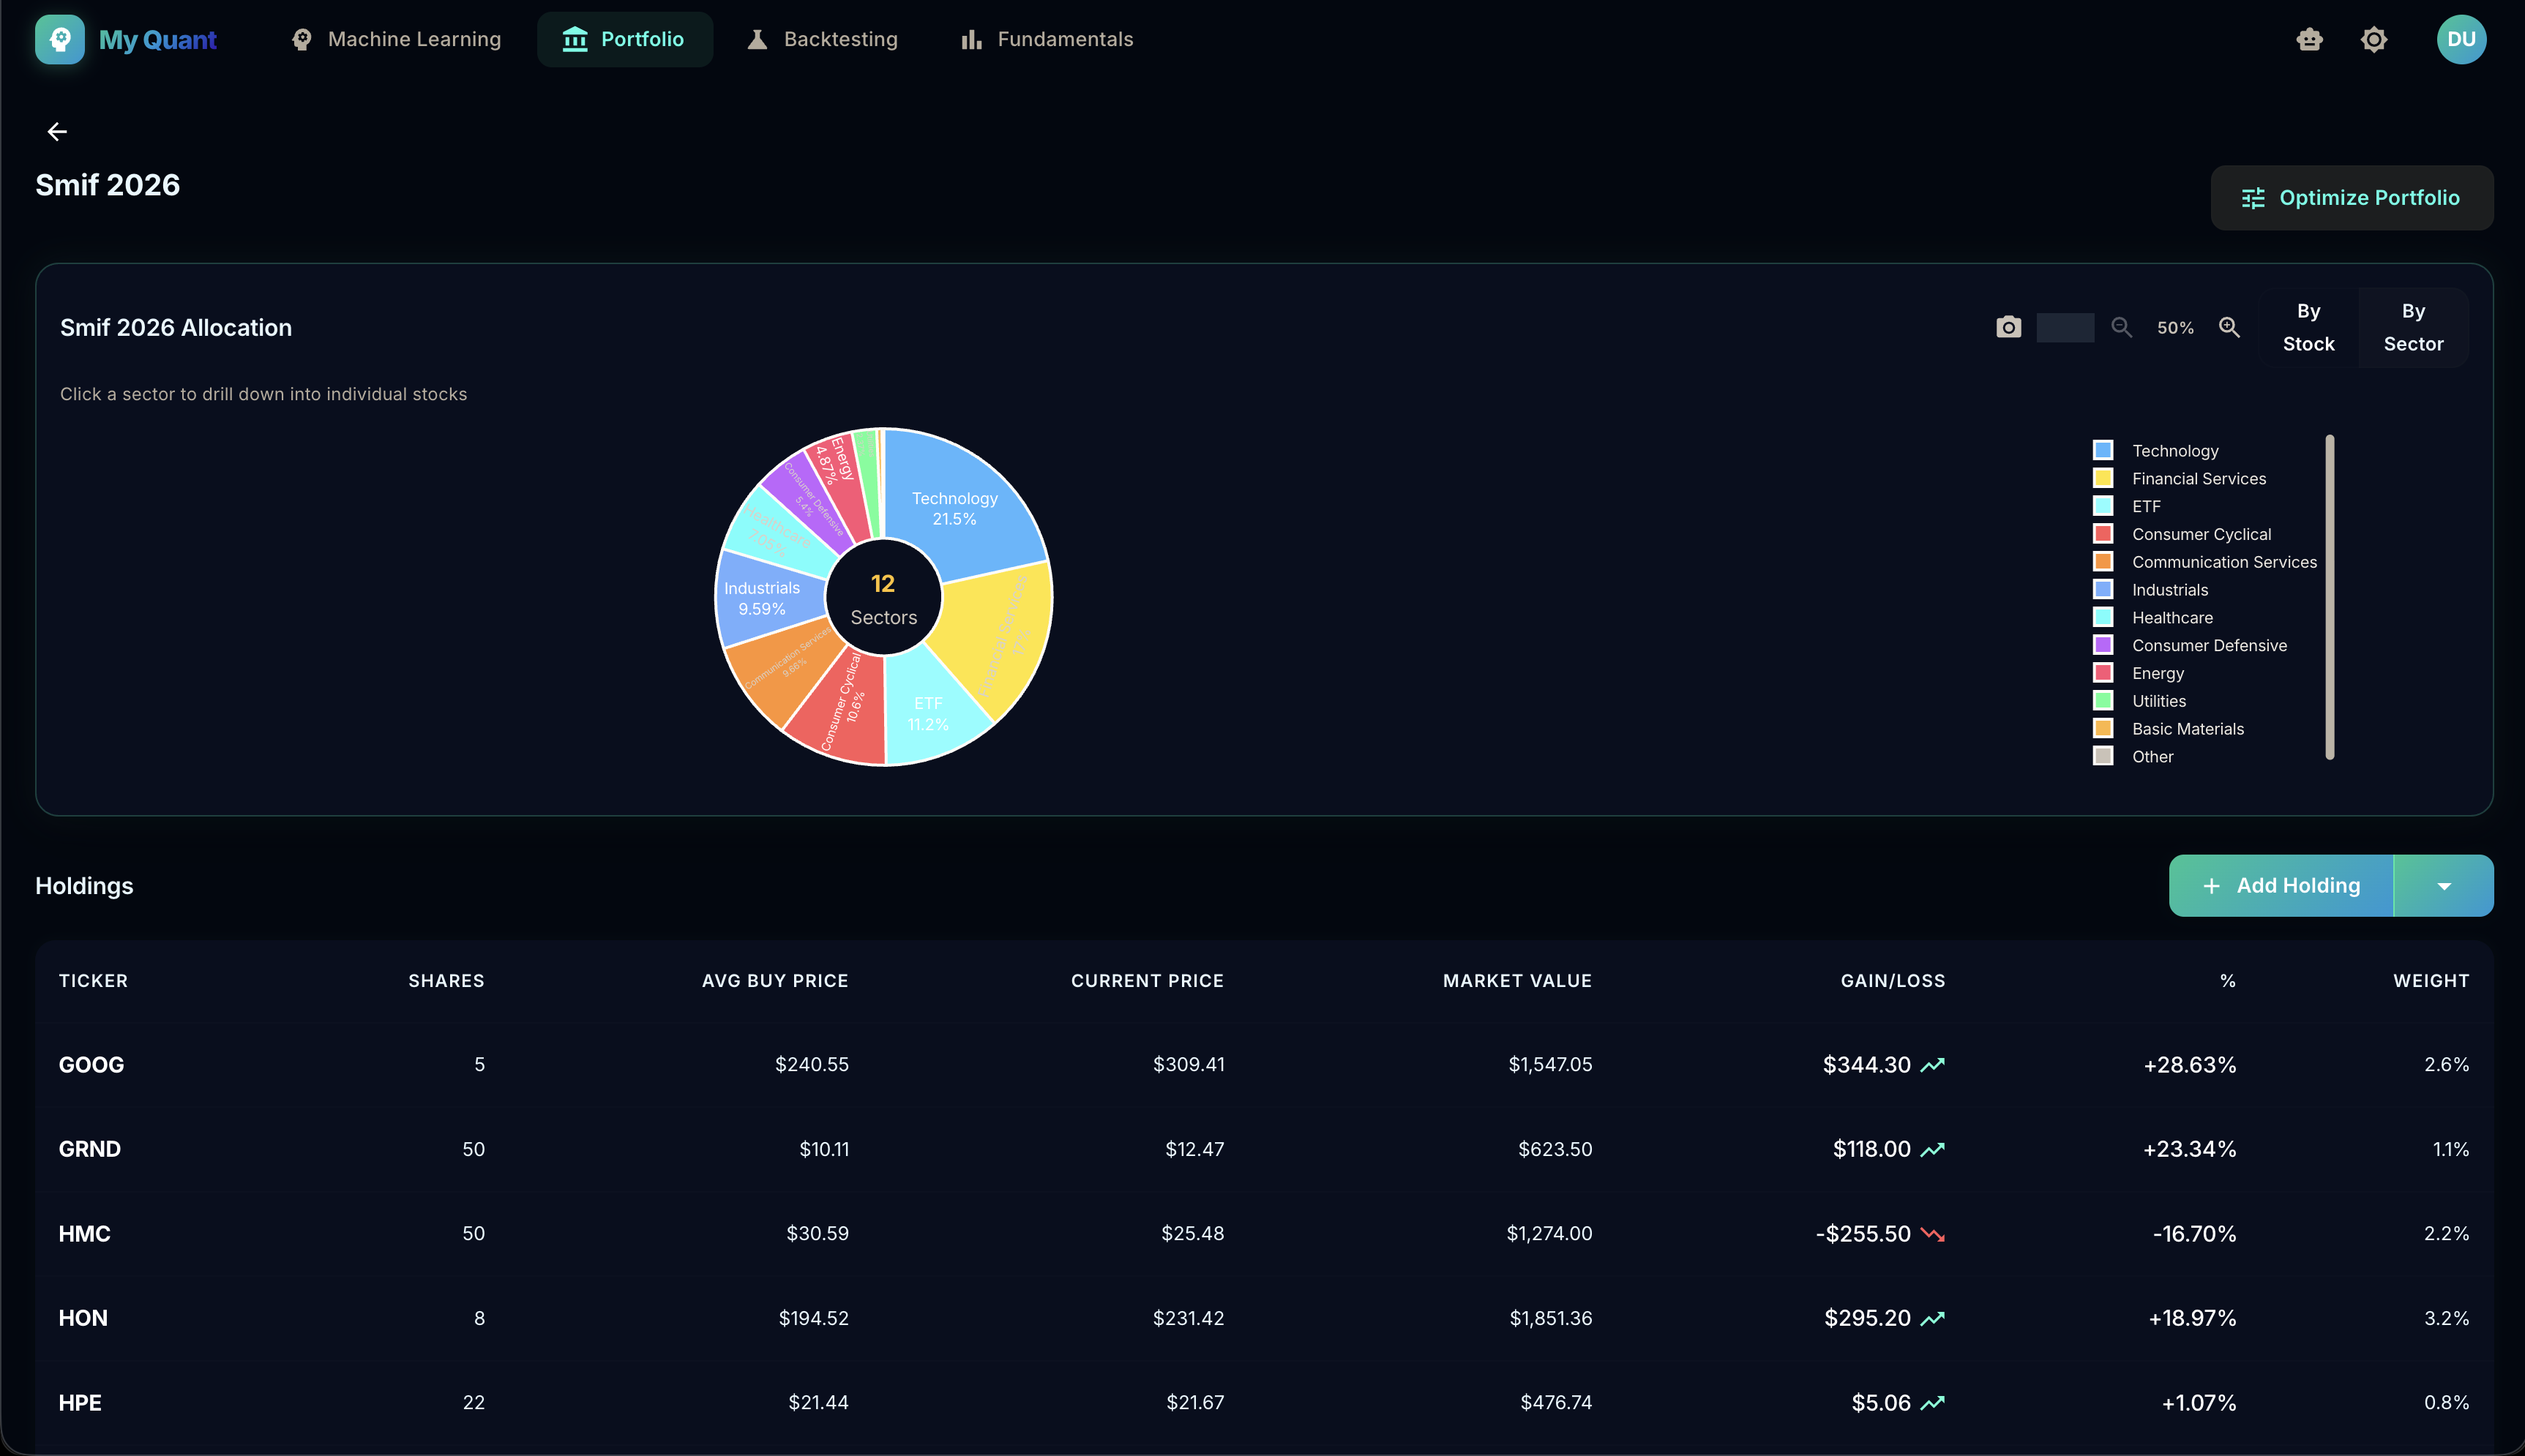
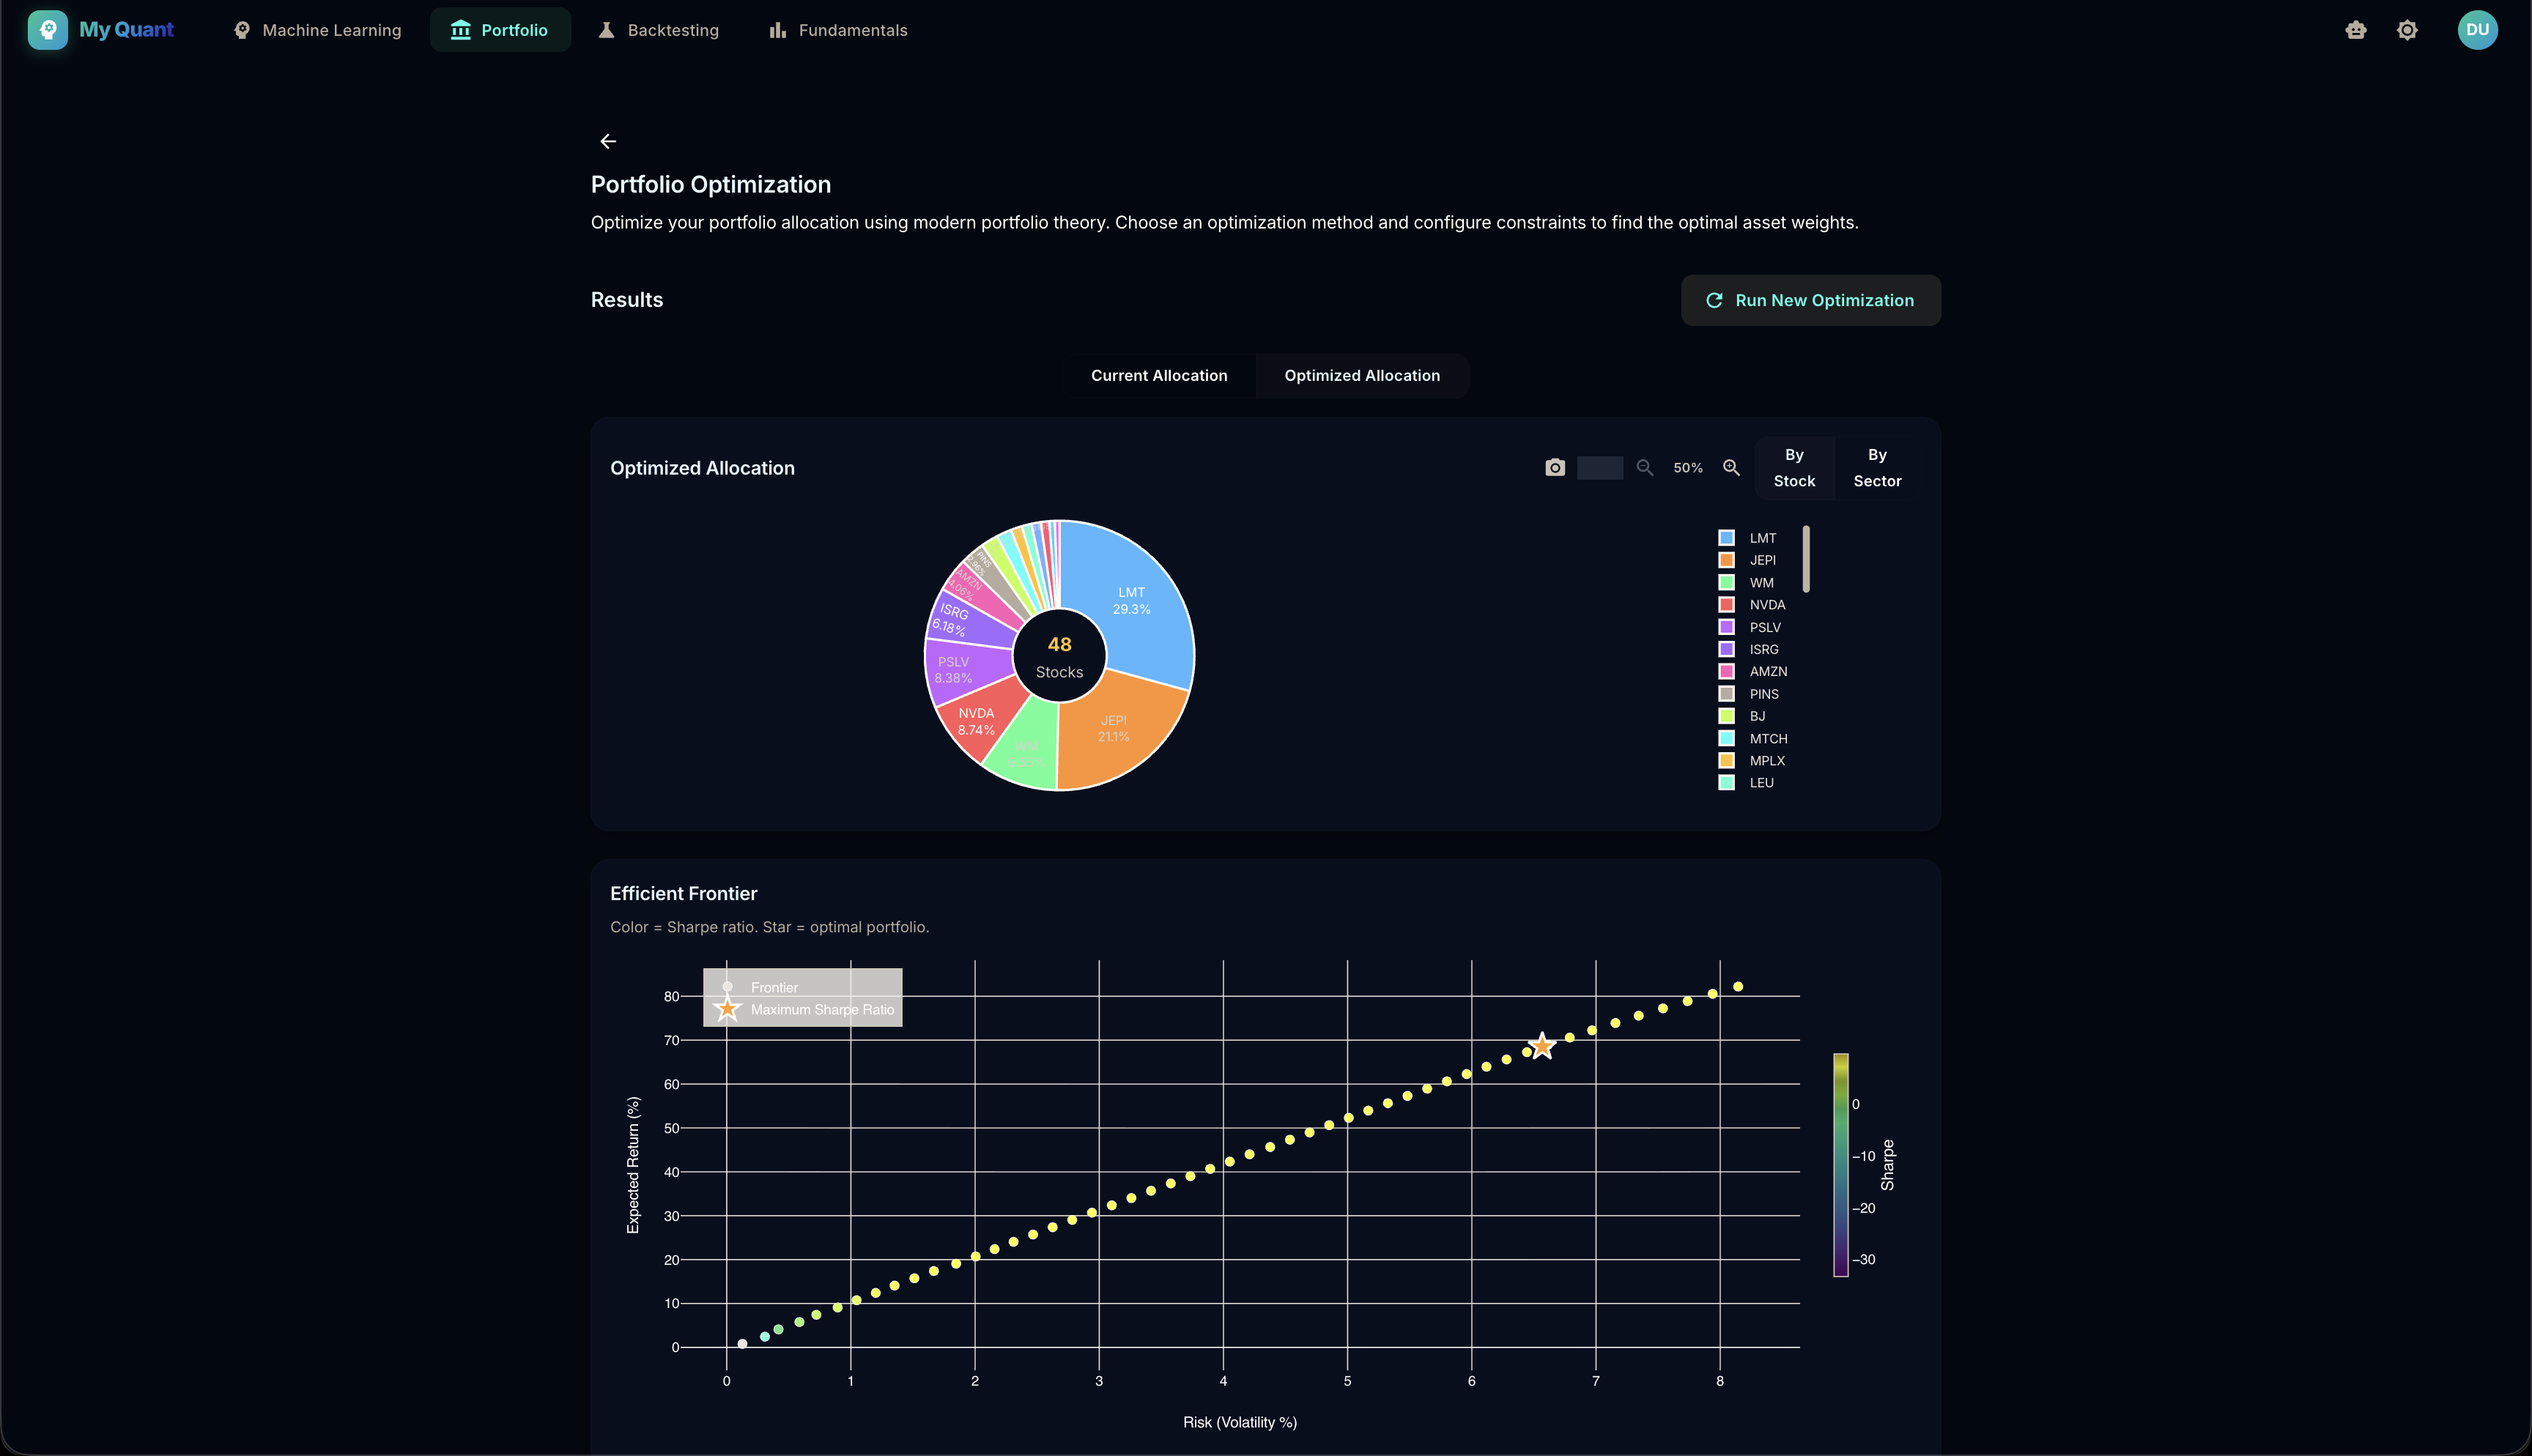
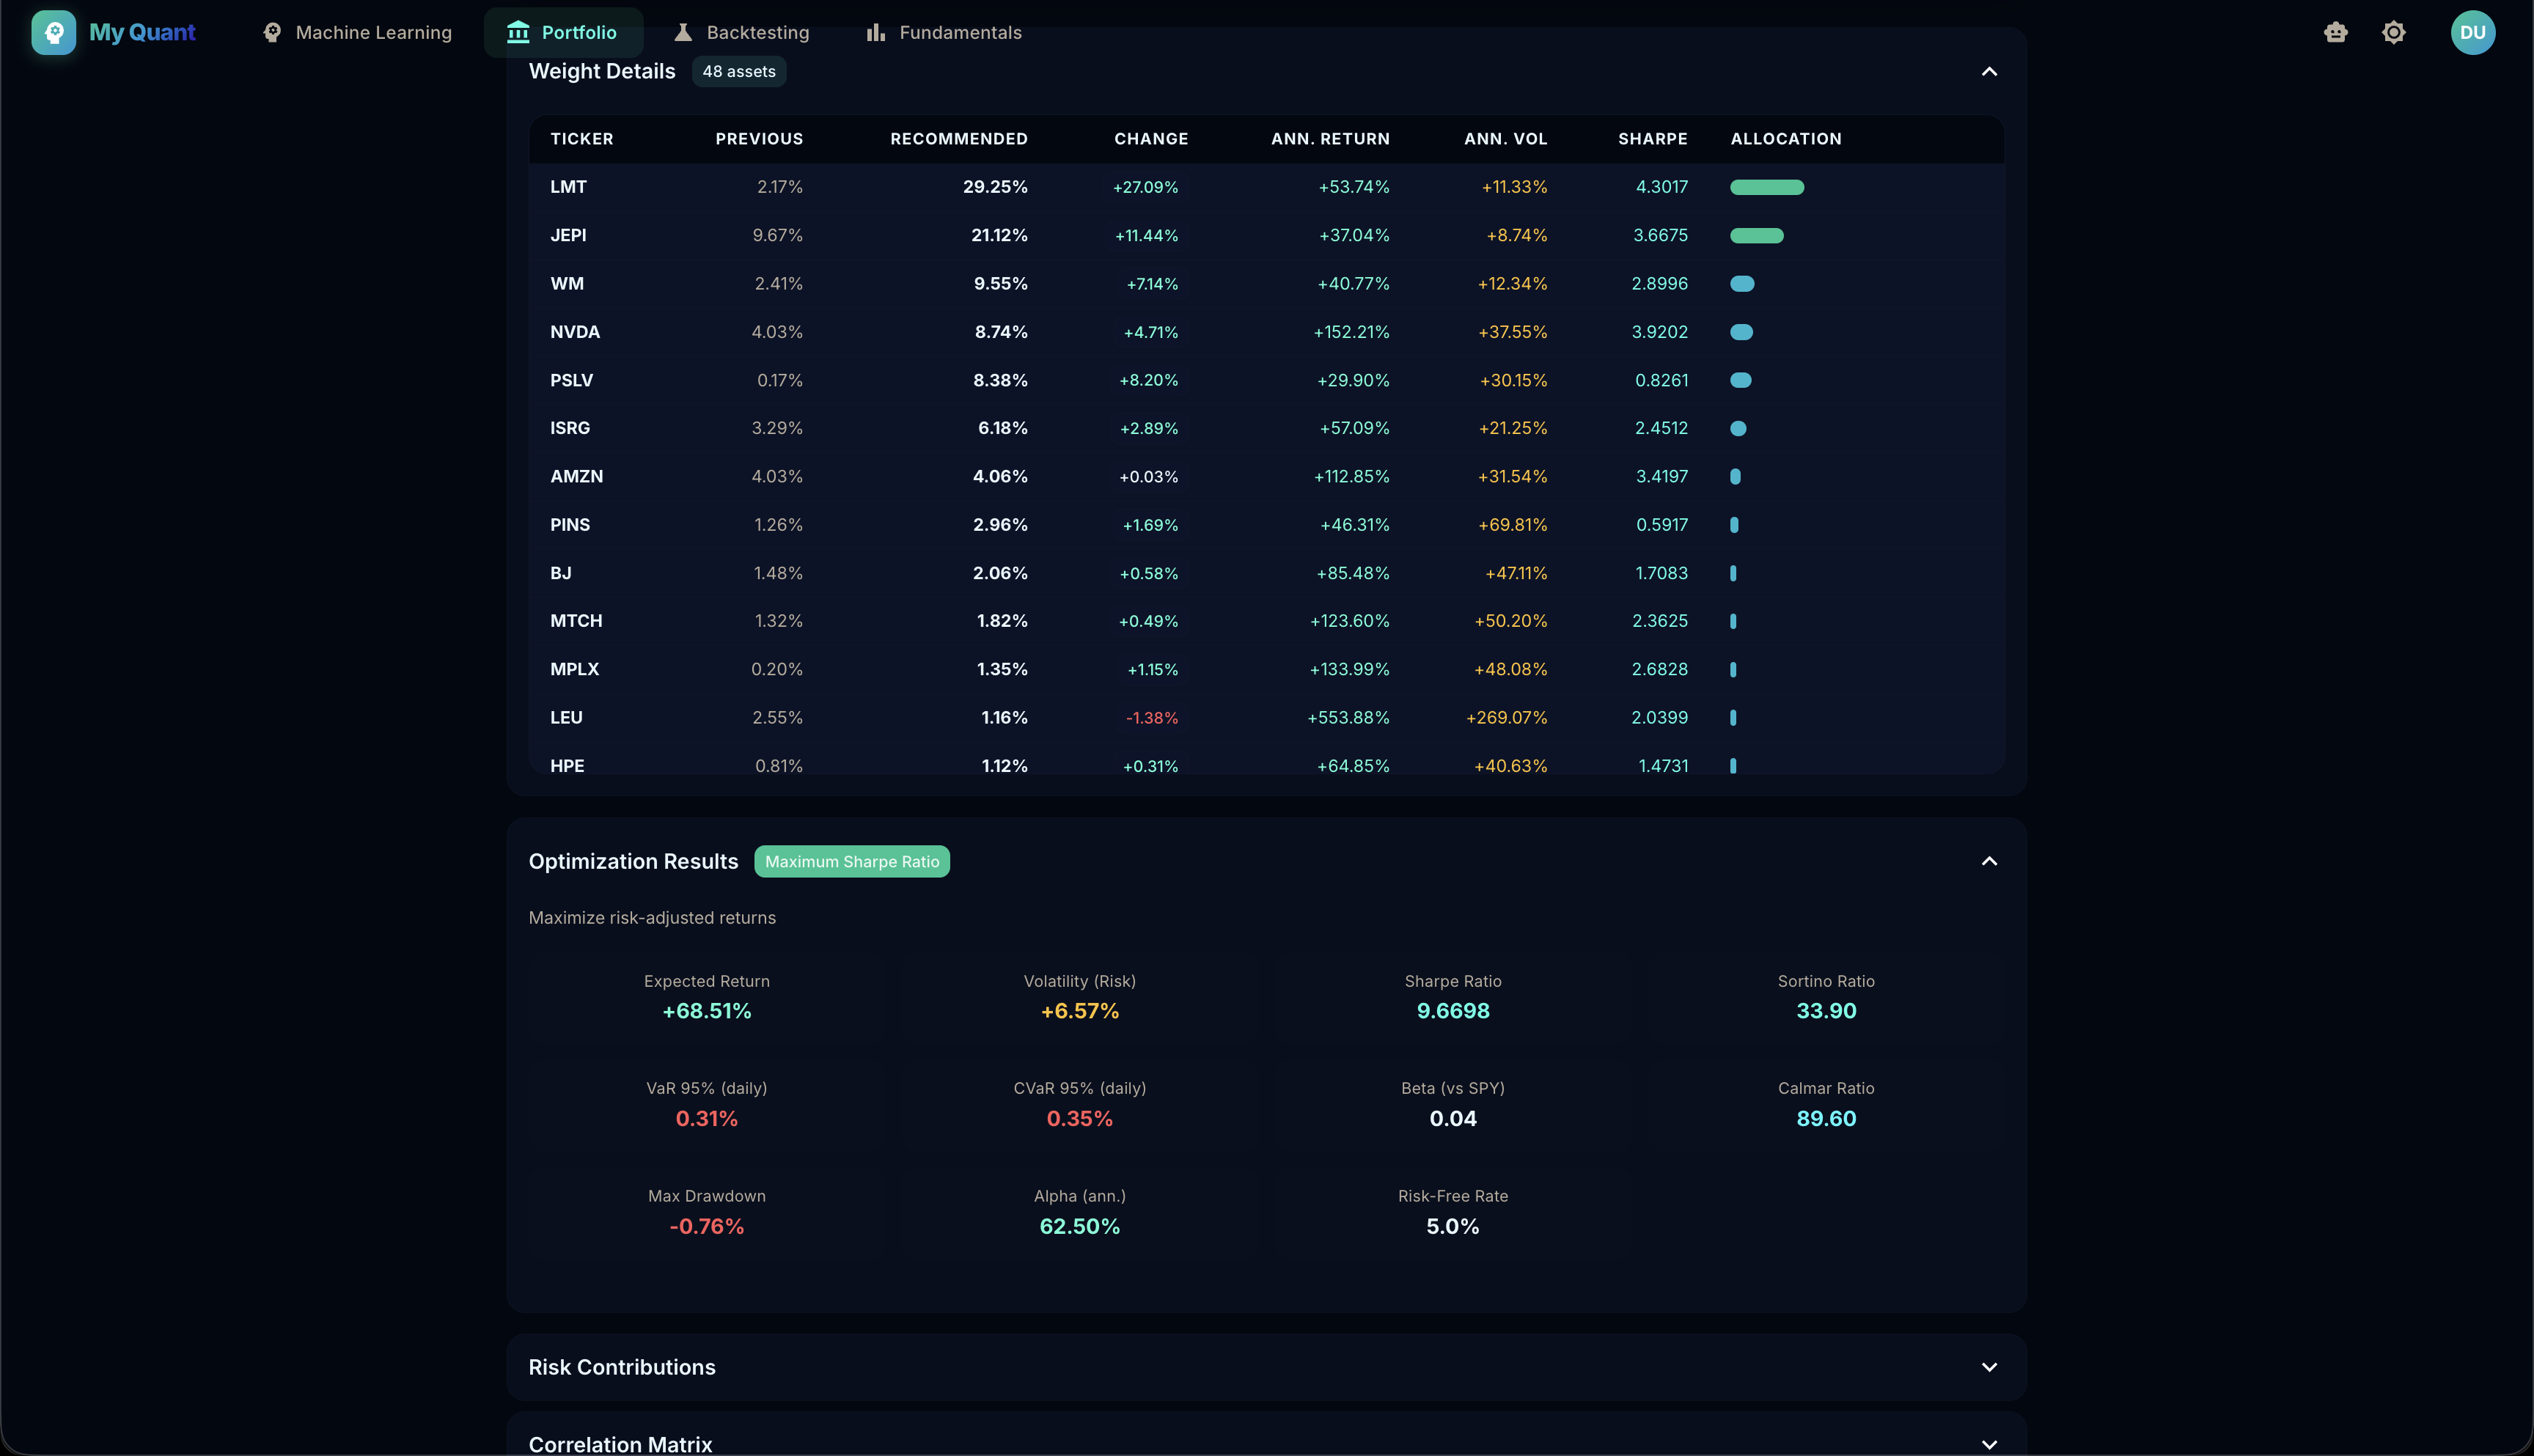
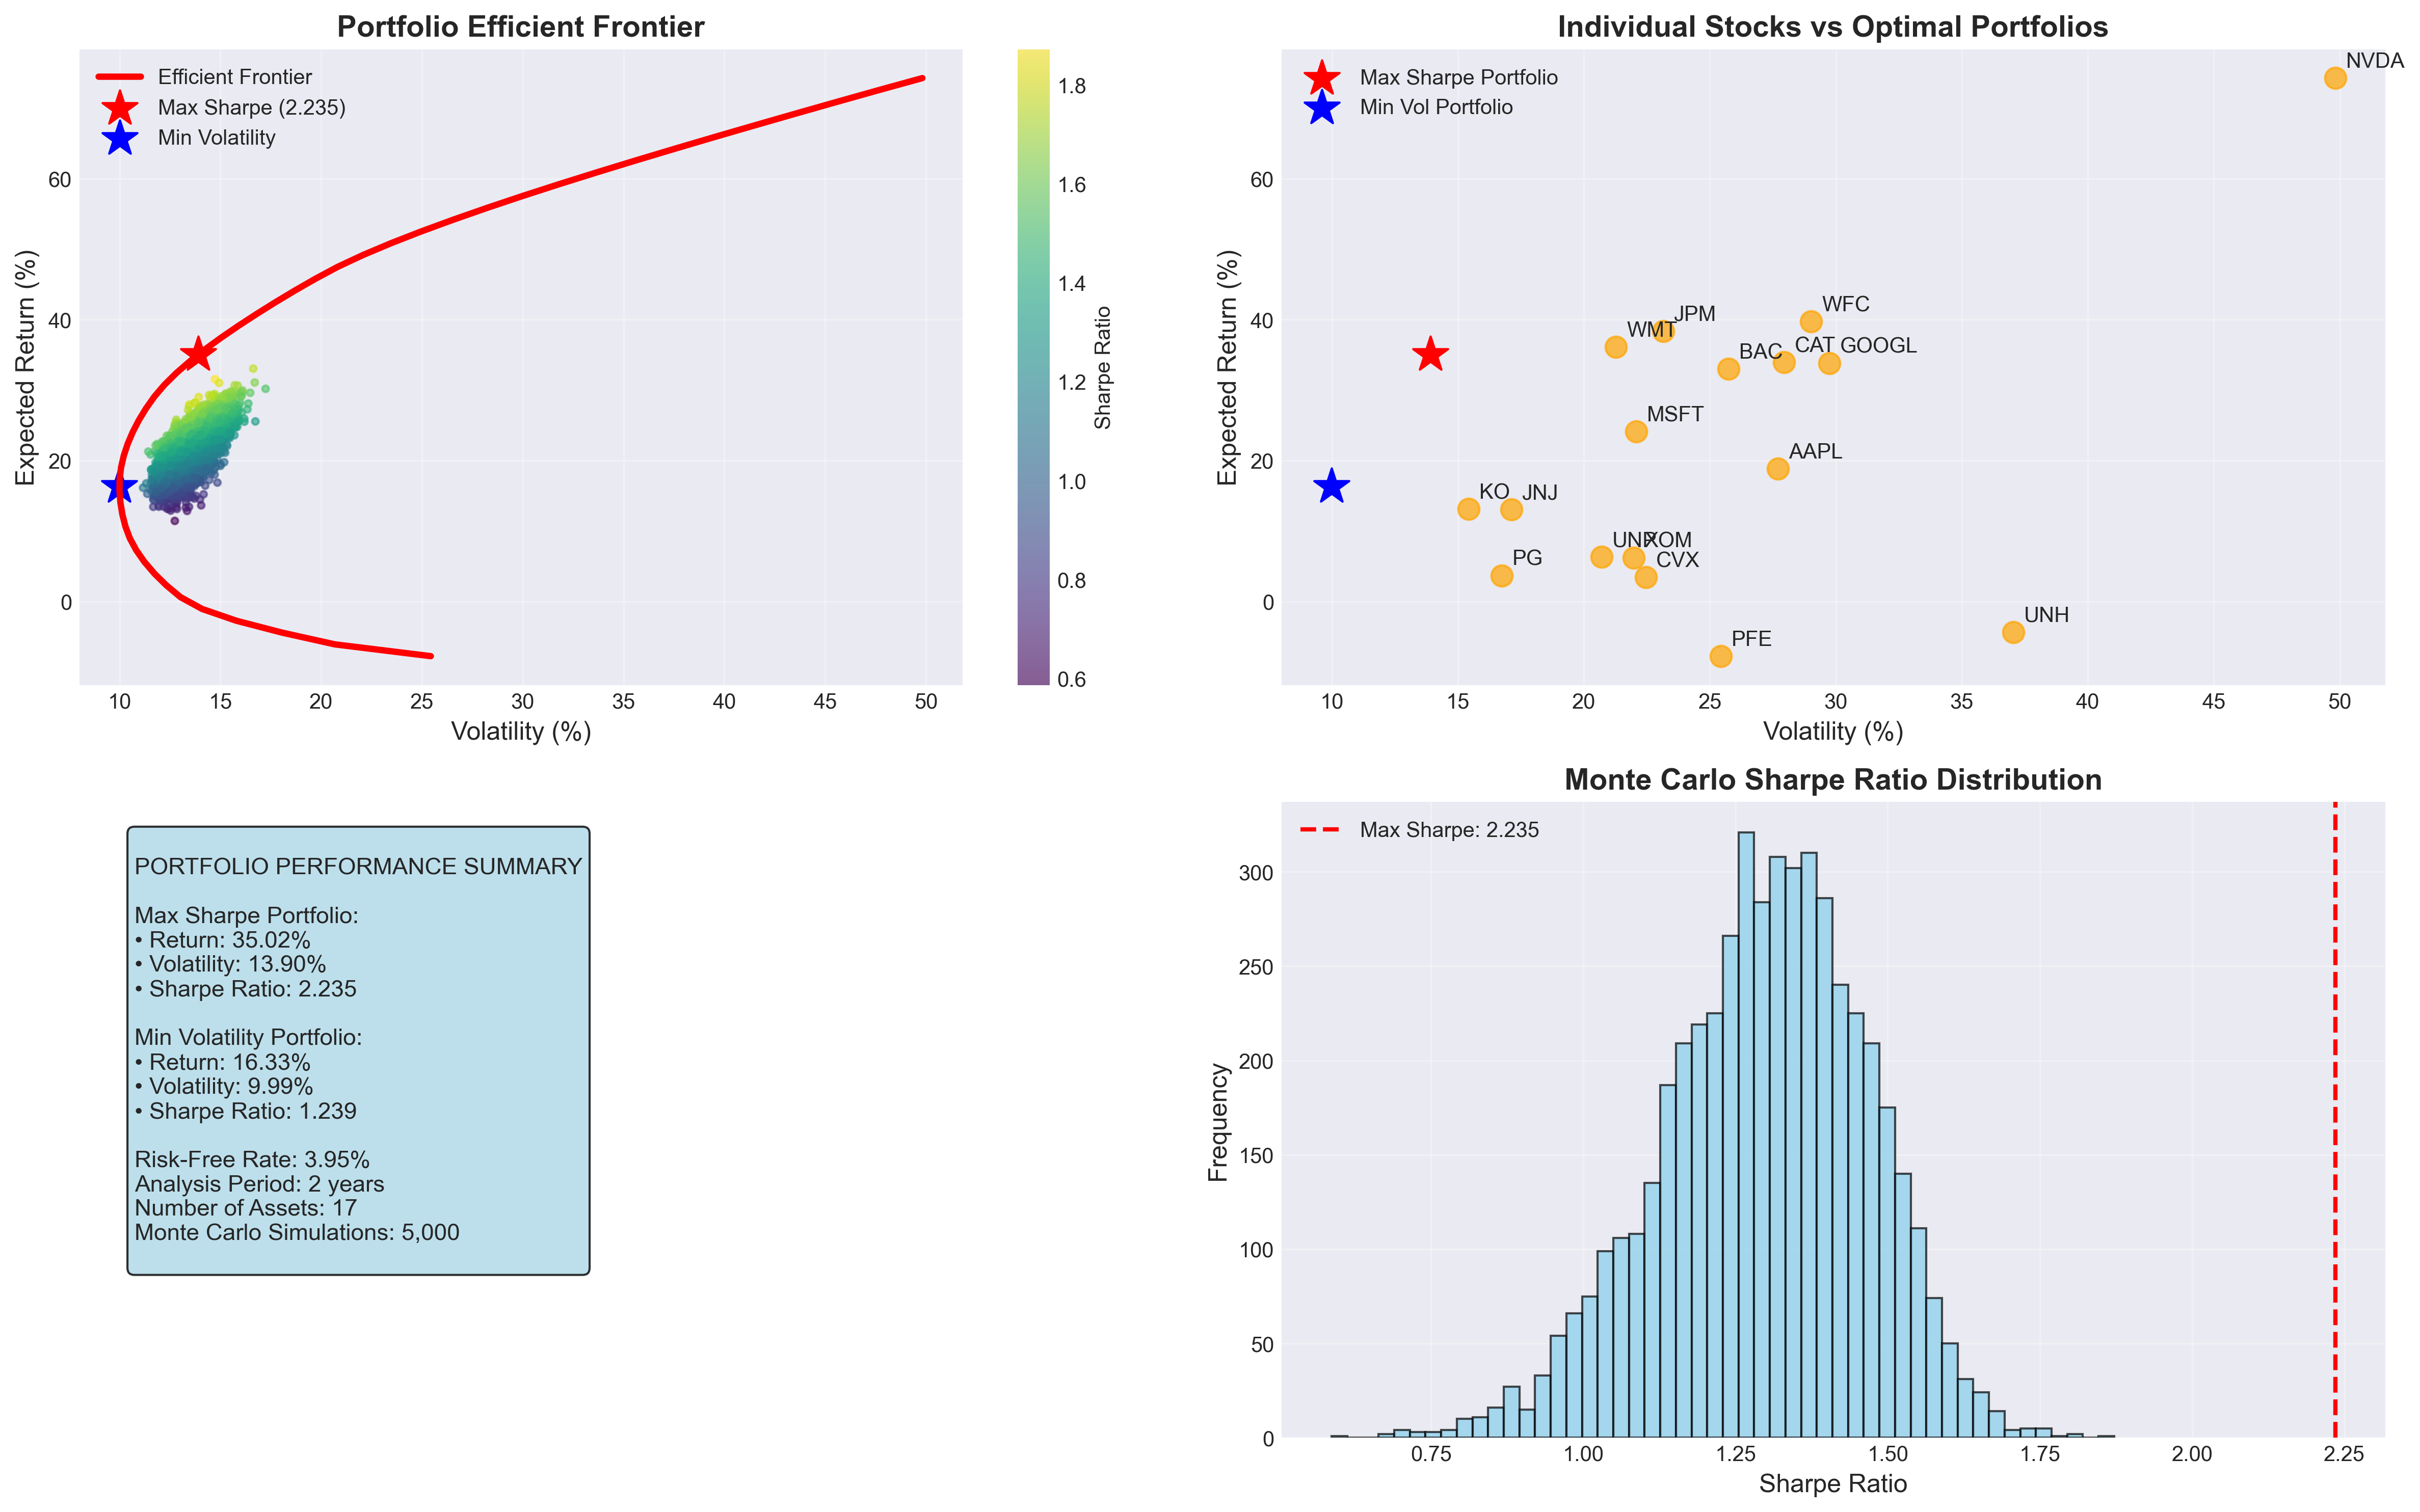
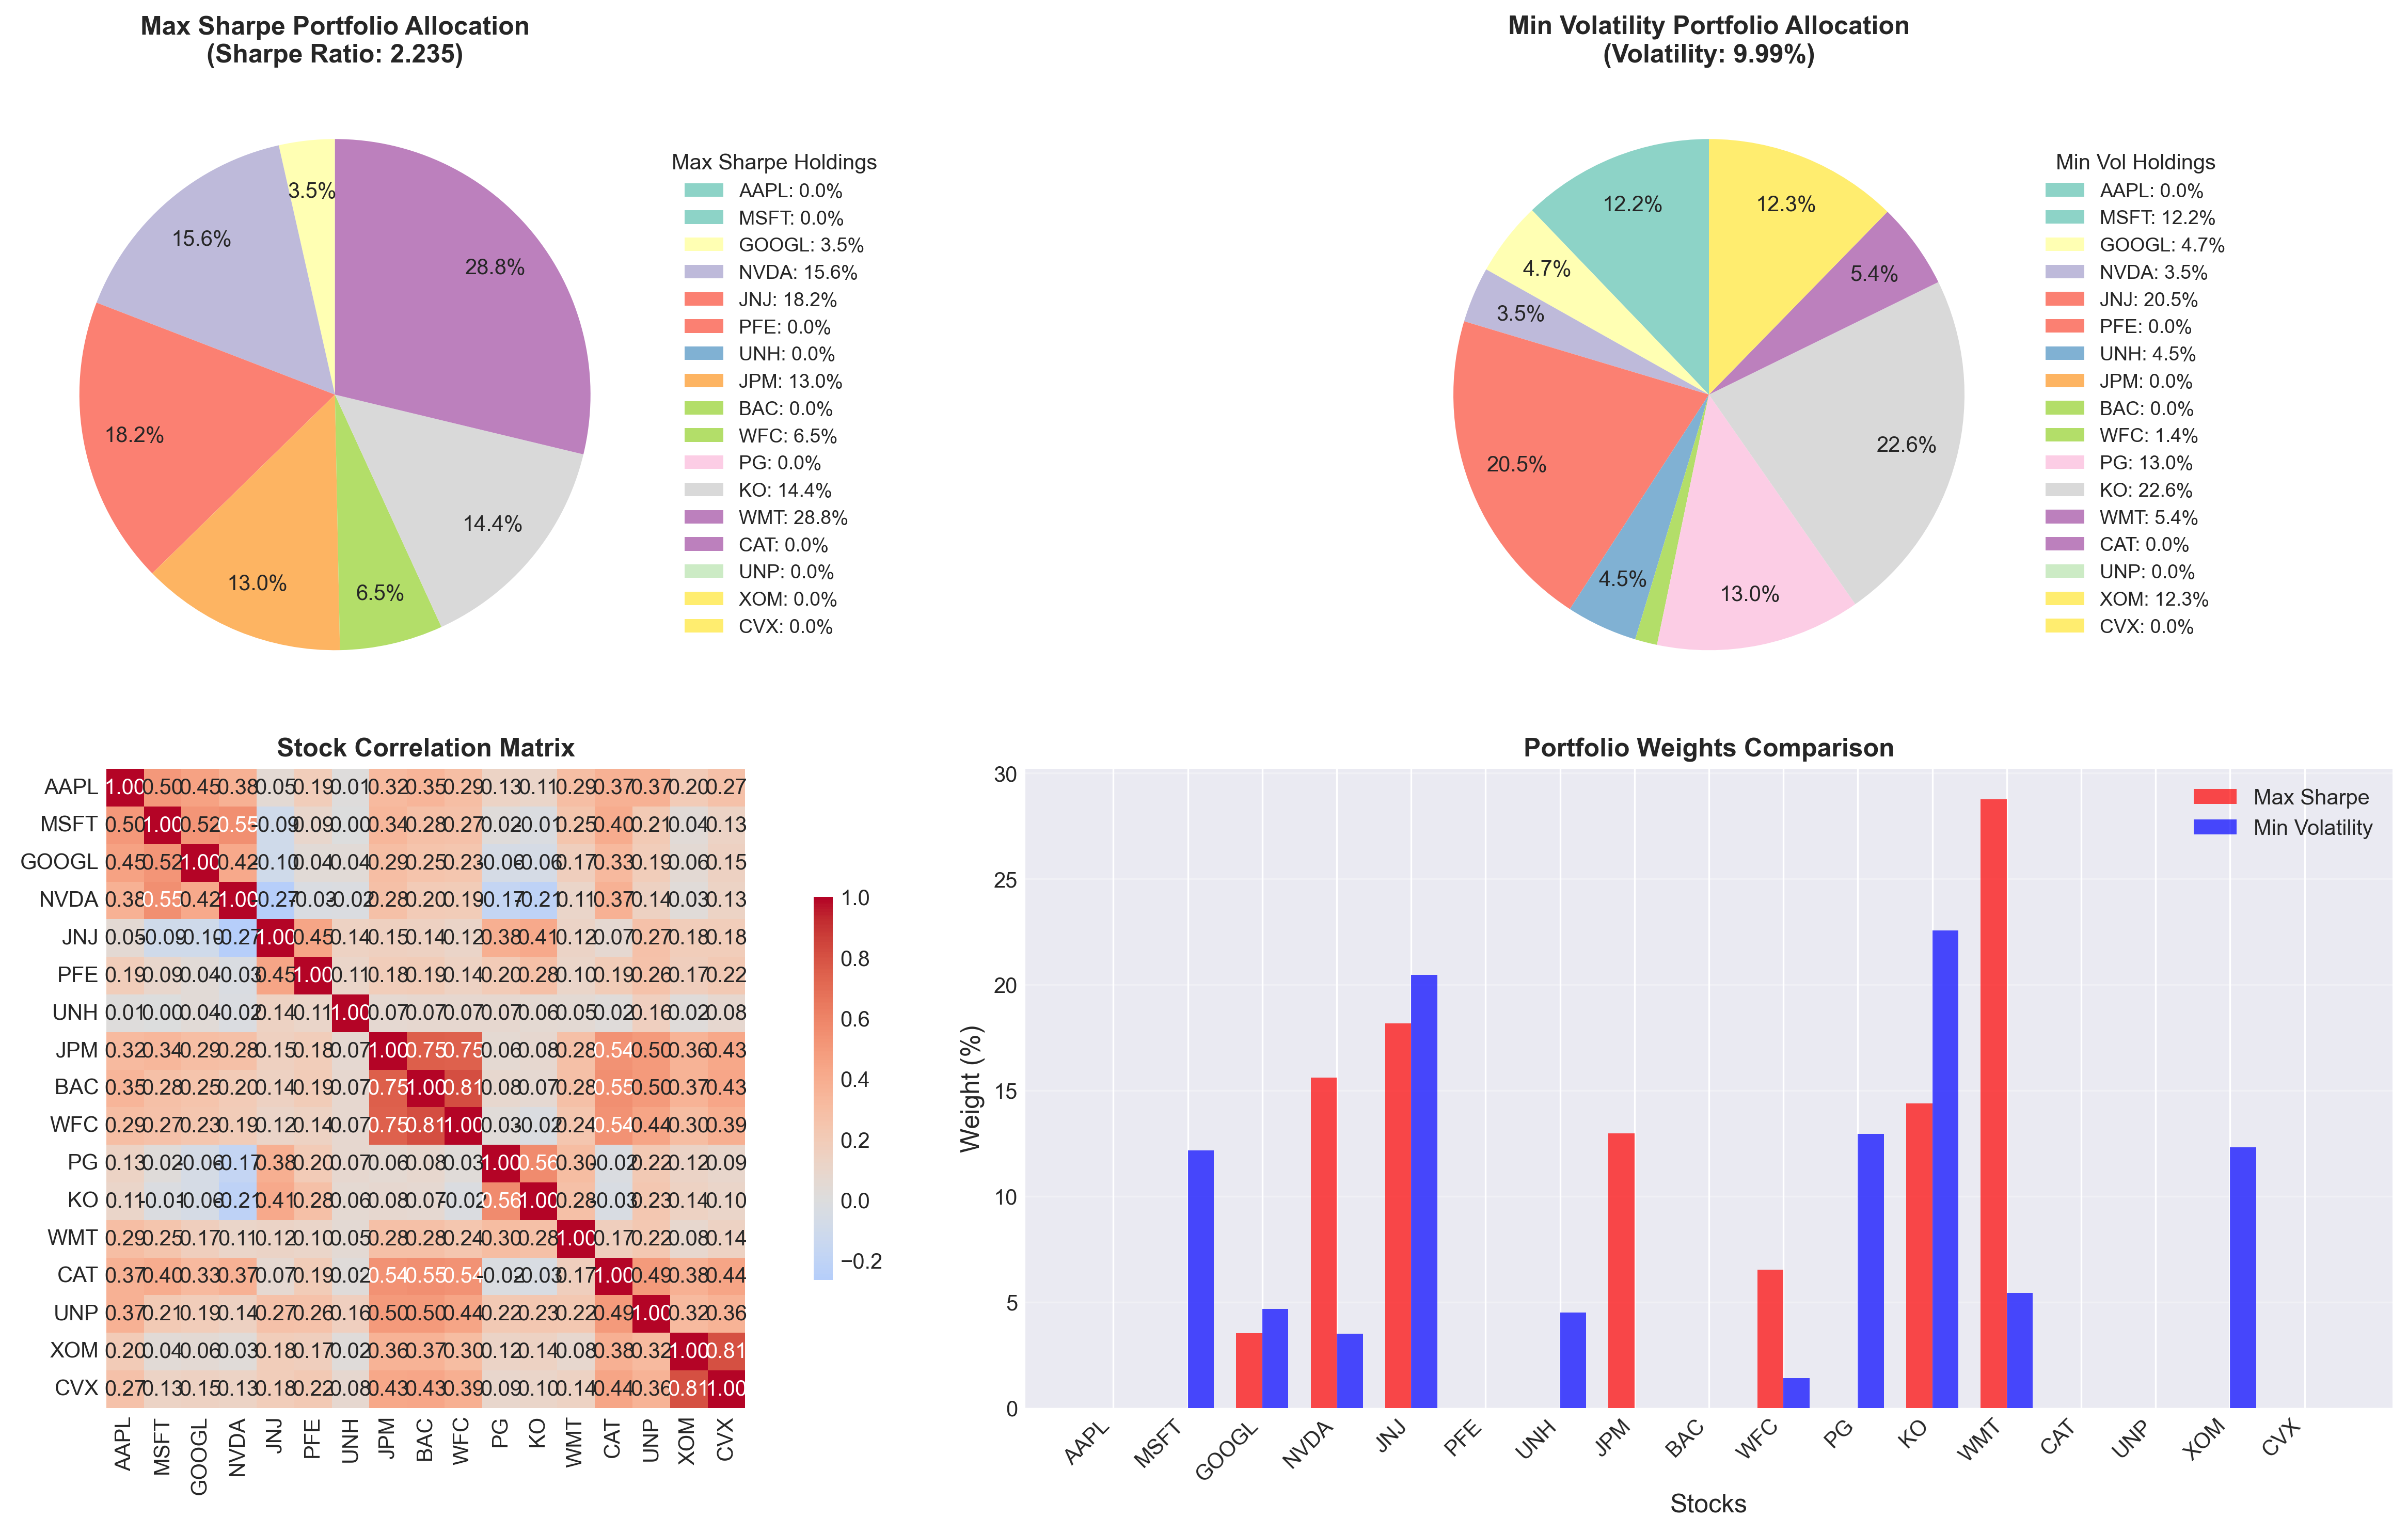
  • Developed a portfolio optimization and risk analytics engine spanning 11 methods from Black-Litterman to regime-aware allocation, with Monte Carlo simulation quantifying VaR, drawdown, and volatility.
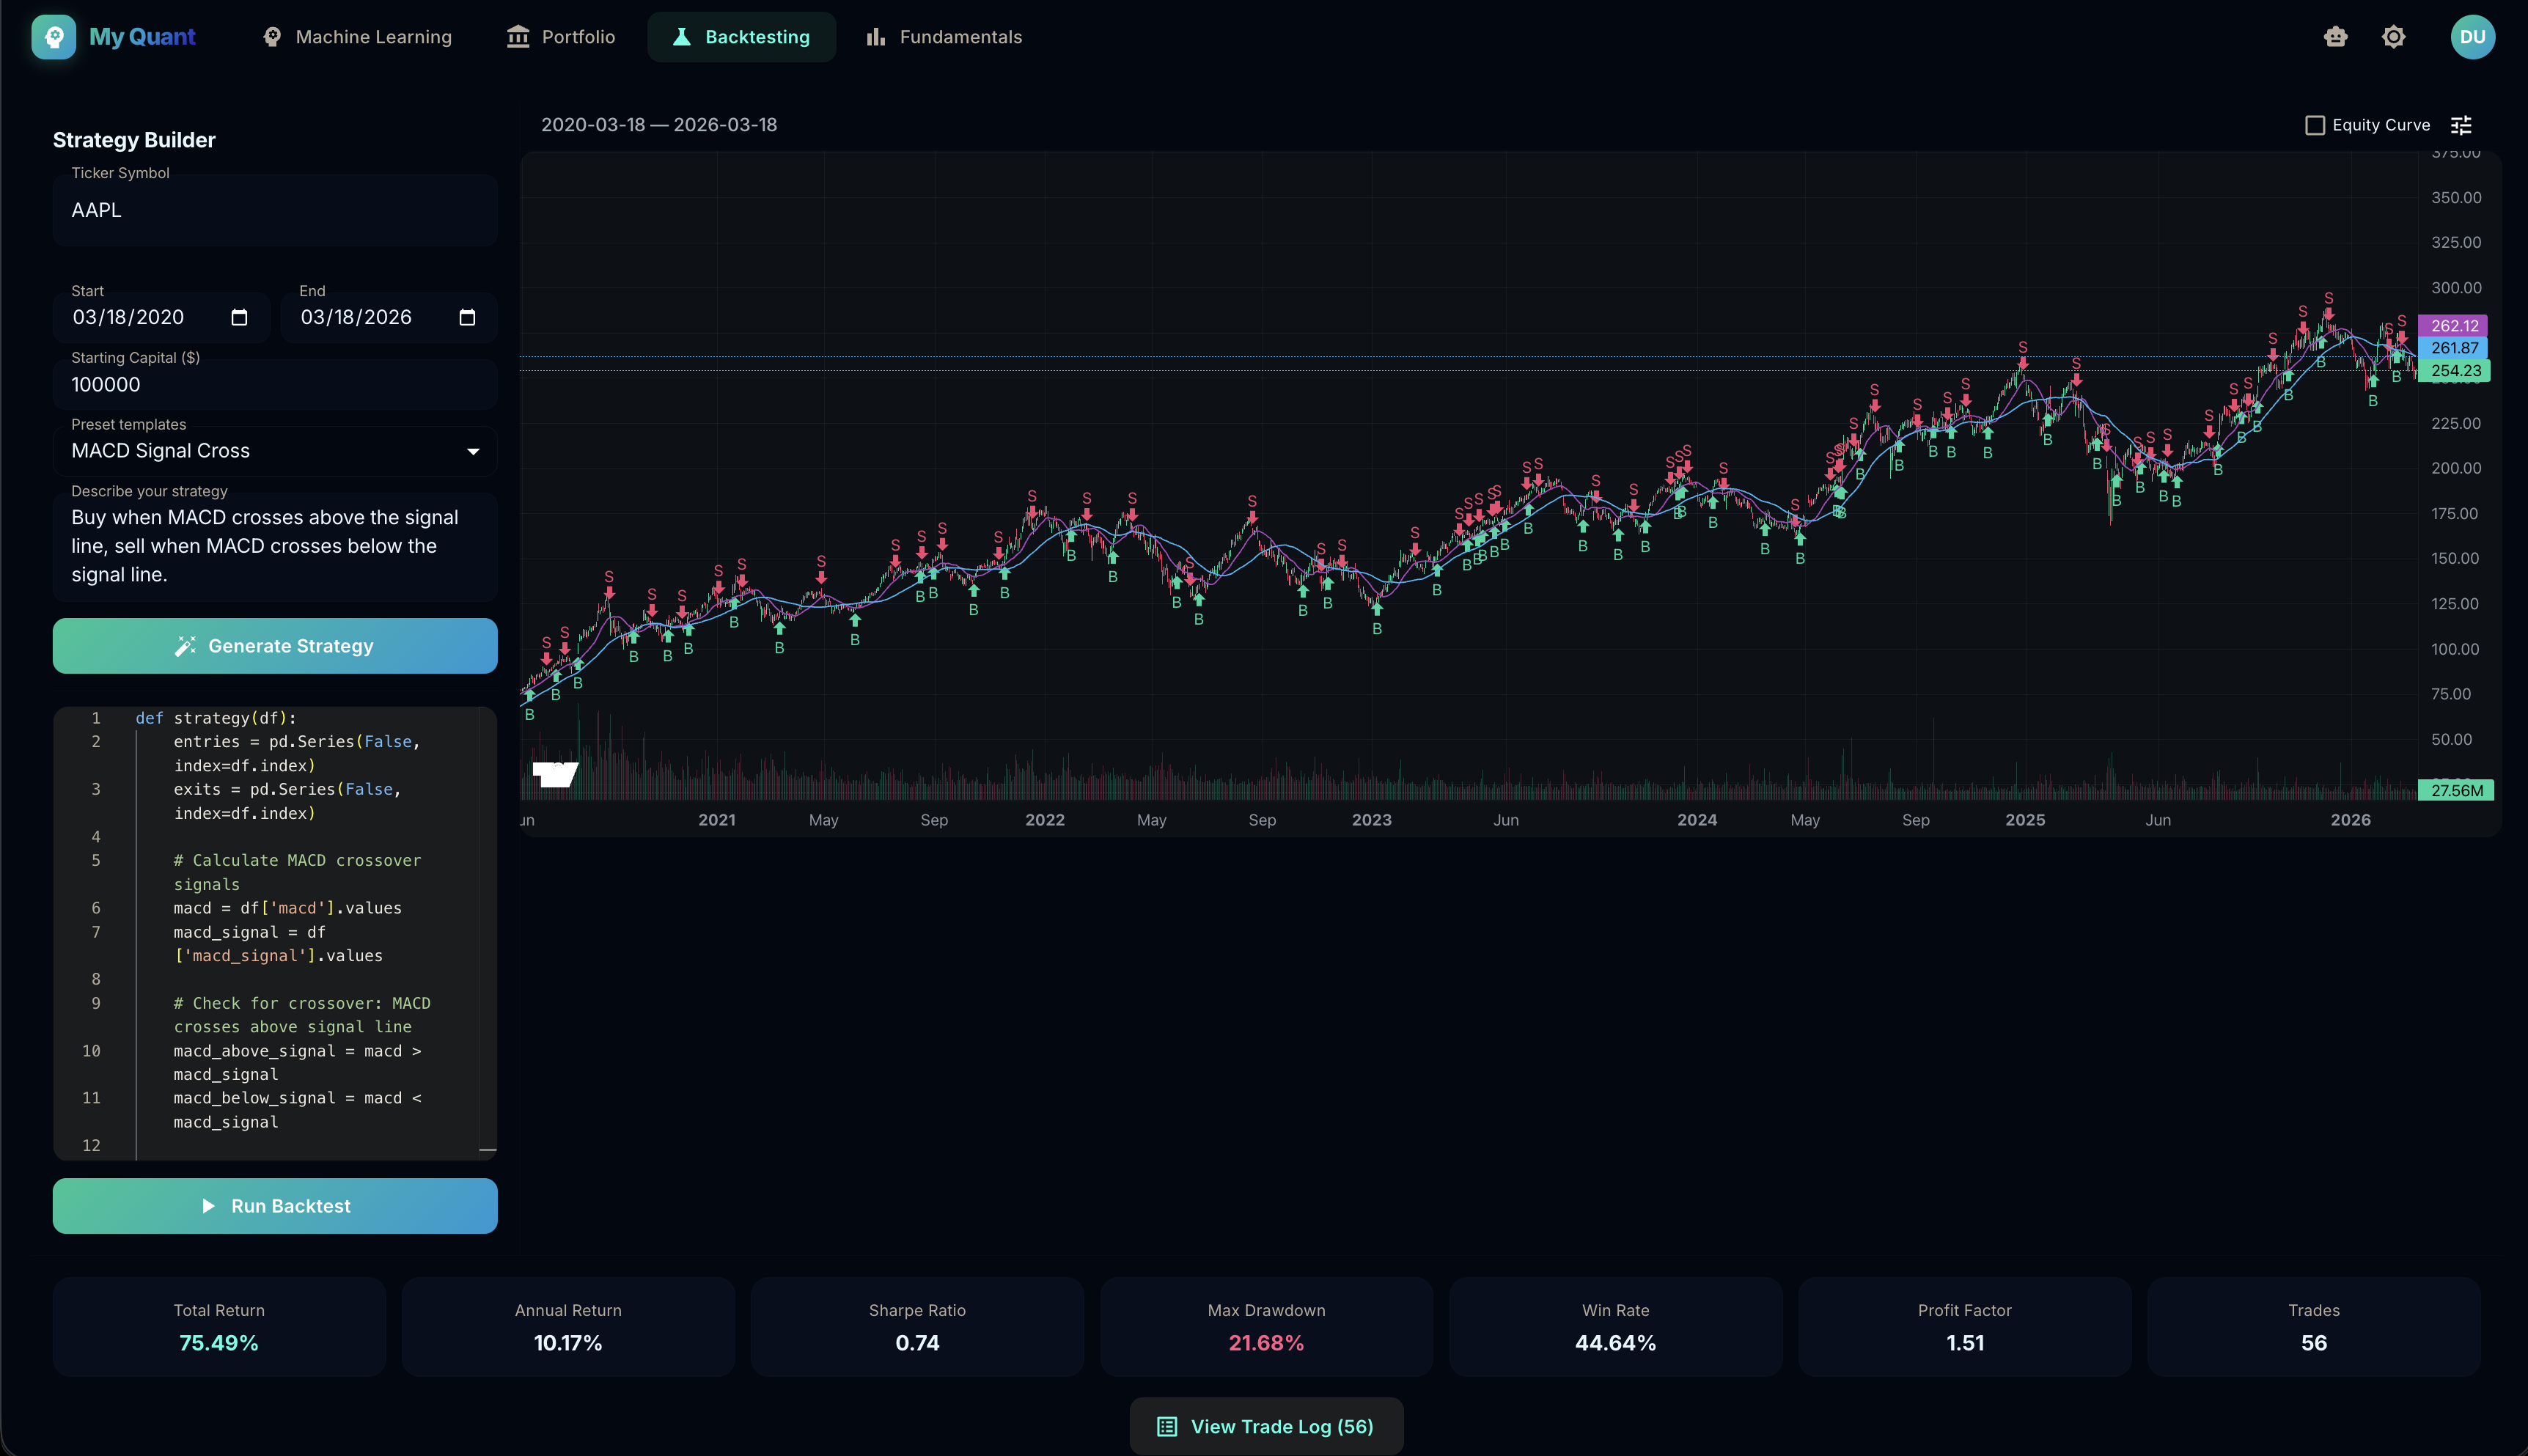
  • Built an algorithmic strategy builder converting signal-driven trading rules into backtests across 8 timeframes with transaction costs and slippage.
  • Implemented an automated system executing strategies via Interactive Brokers under configurable risk limits, logging trade-level P&L.
  • Orchestrated 8 multi-agent LLM teams, using knowledge graphs and RAG with MCP tool calls to run platform functions and reason over outputs, making the entire quant stack operable through natural language.
data9 providers
allocation11 optimization methods
backtest8 timeframes, costs + slippage
executionInteractive Brokers, risk limits
interfaceMulti-agent LLM, RAG, MCP
  • Python 3.13
  • FastAPI
  • React + TypeScript
  • PostgreSQL
  • Redis
  • Docker
  • Anthropic API
  • Knowledge Graphs
  • RAG
  • MCP
  • Plotly
  • IBKR API
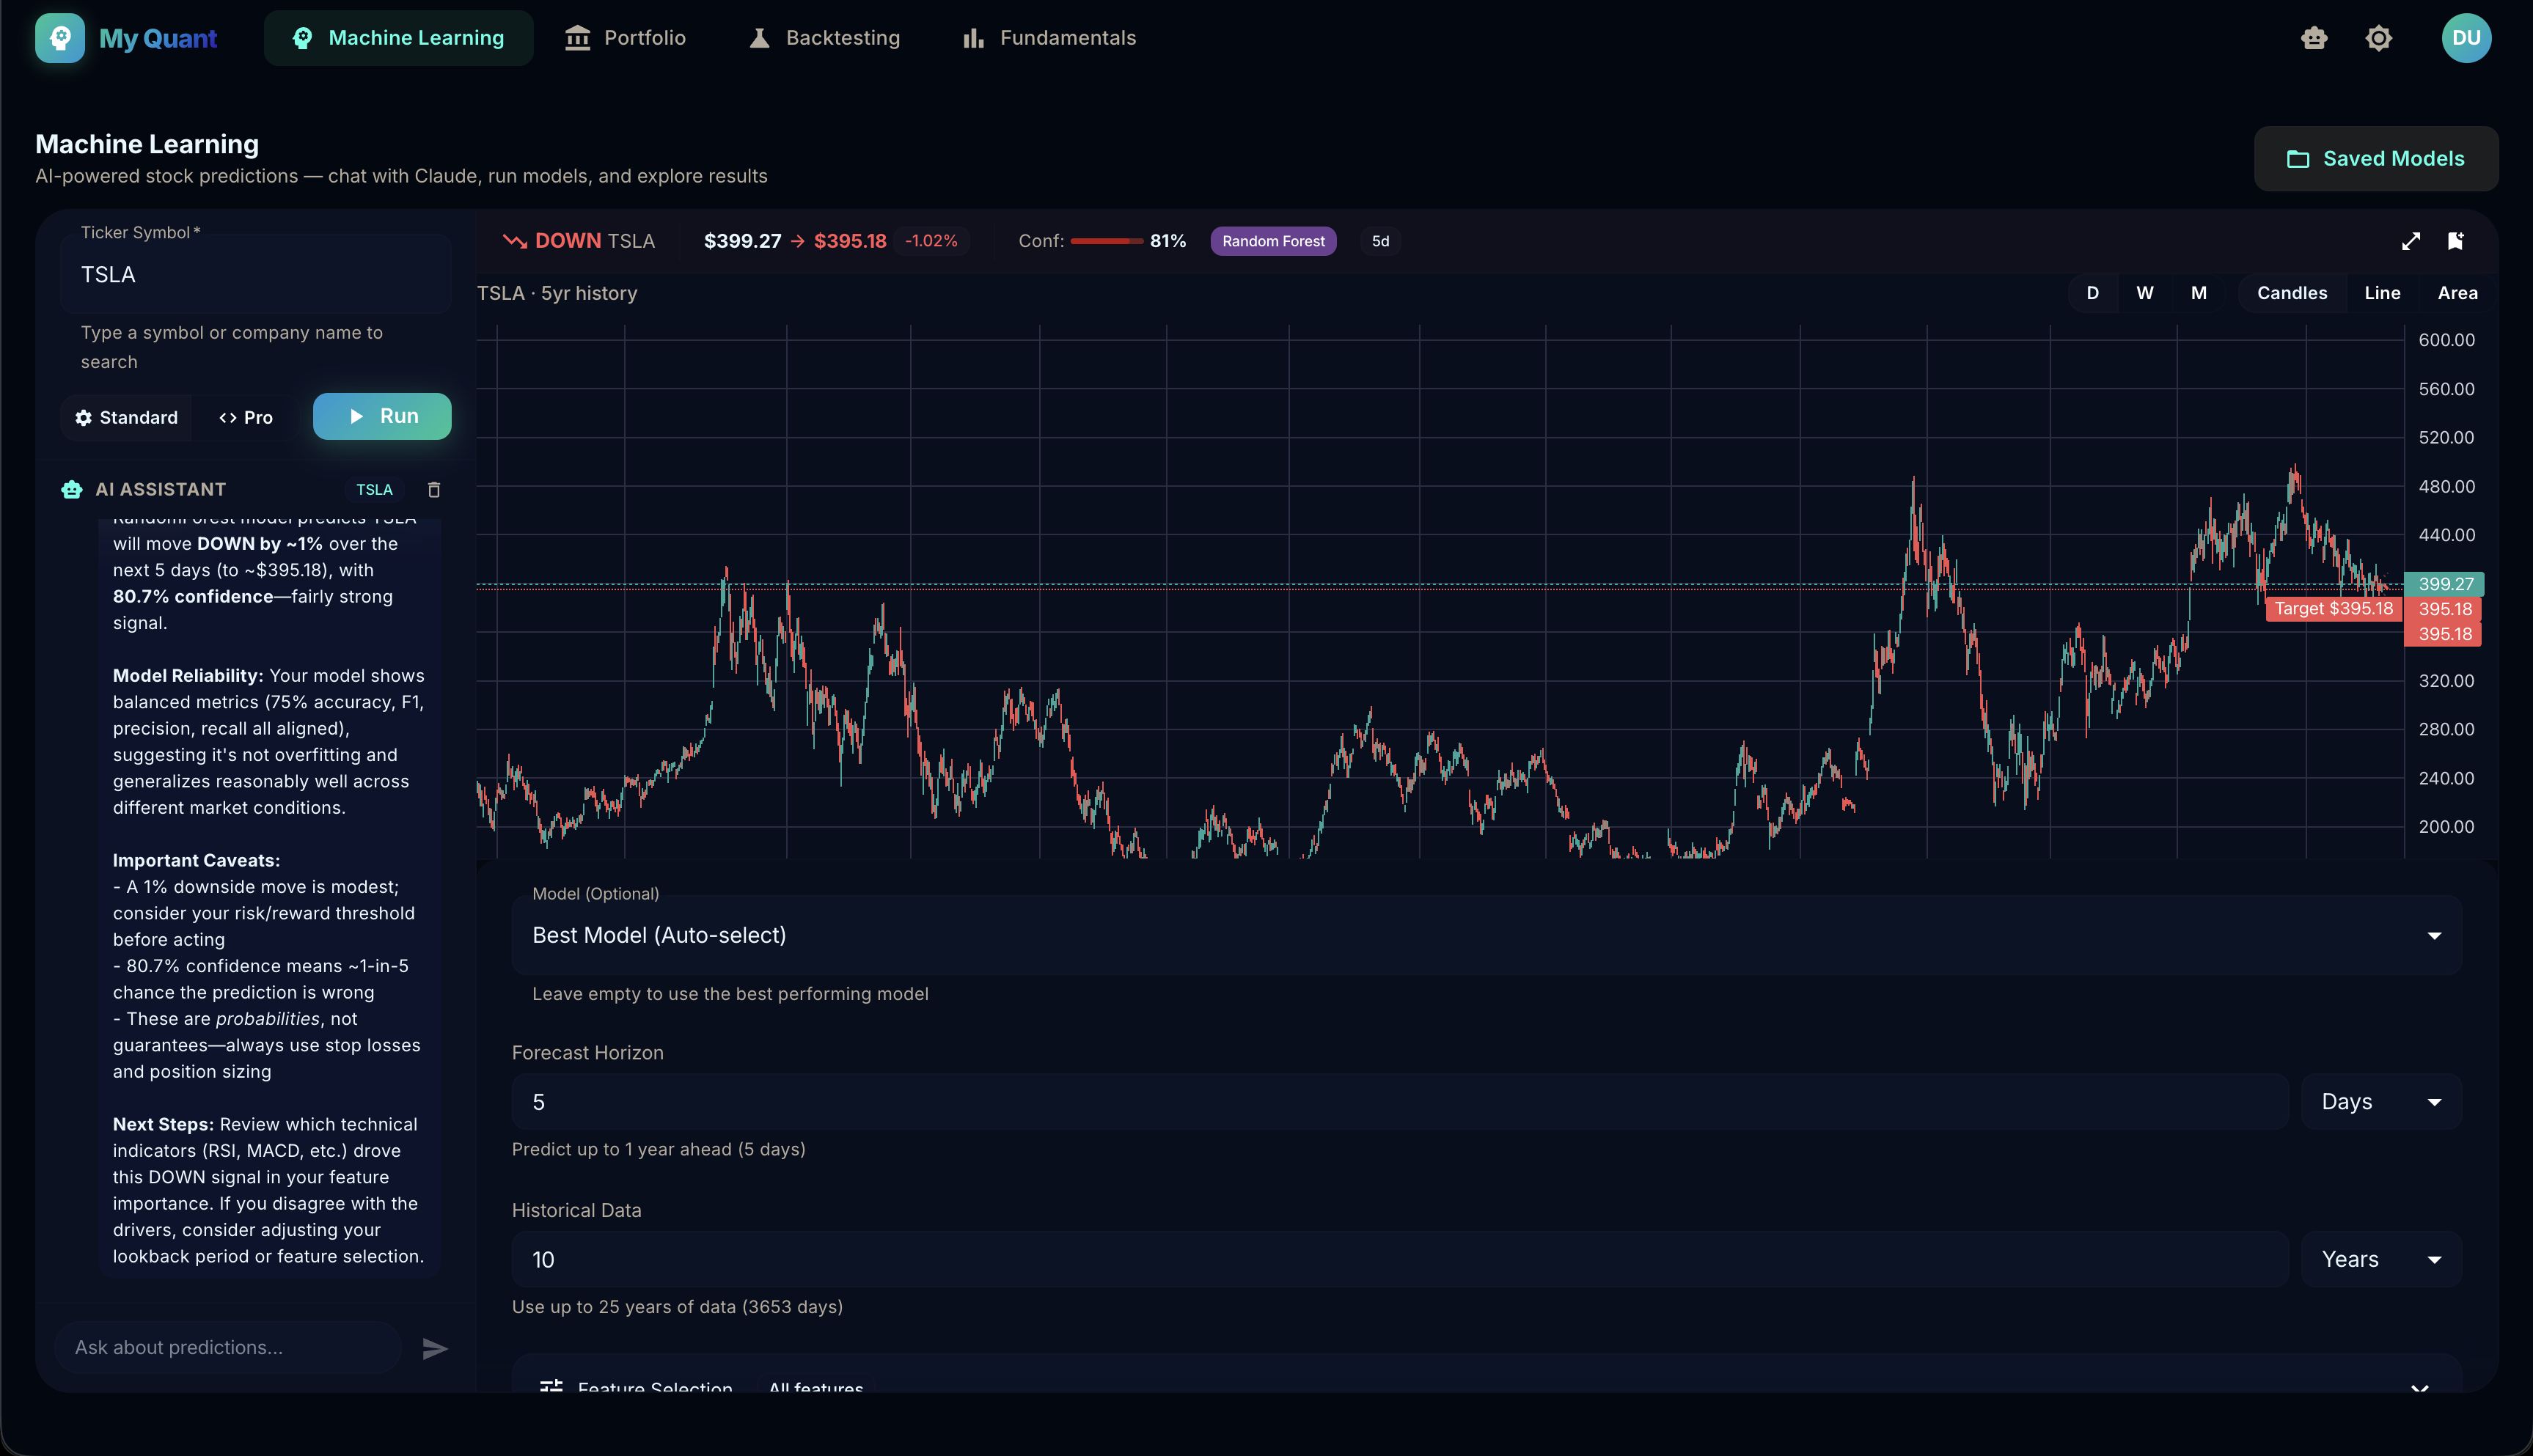
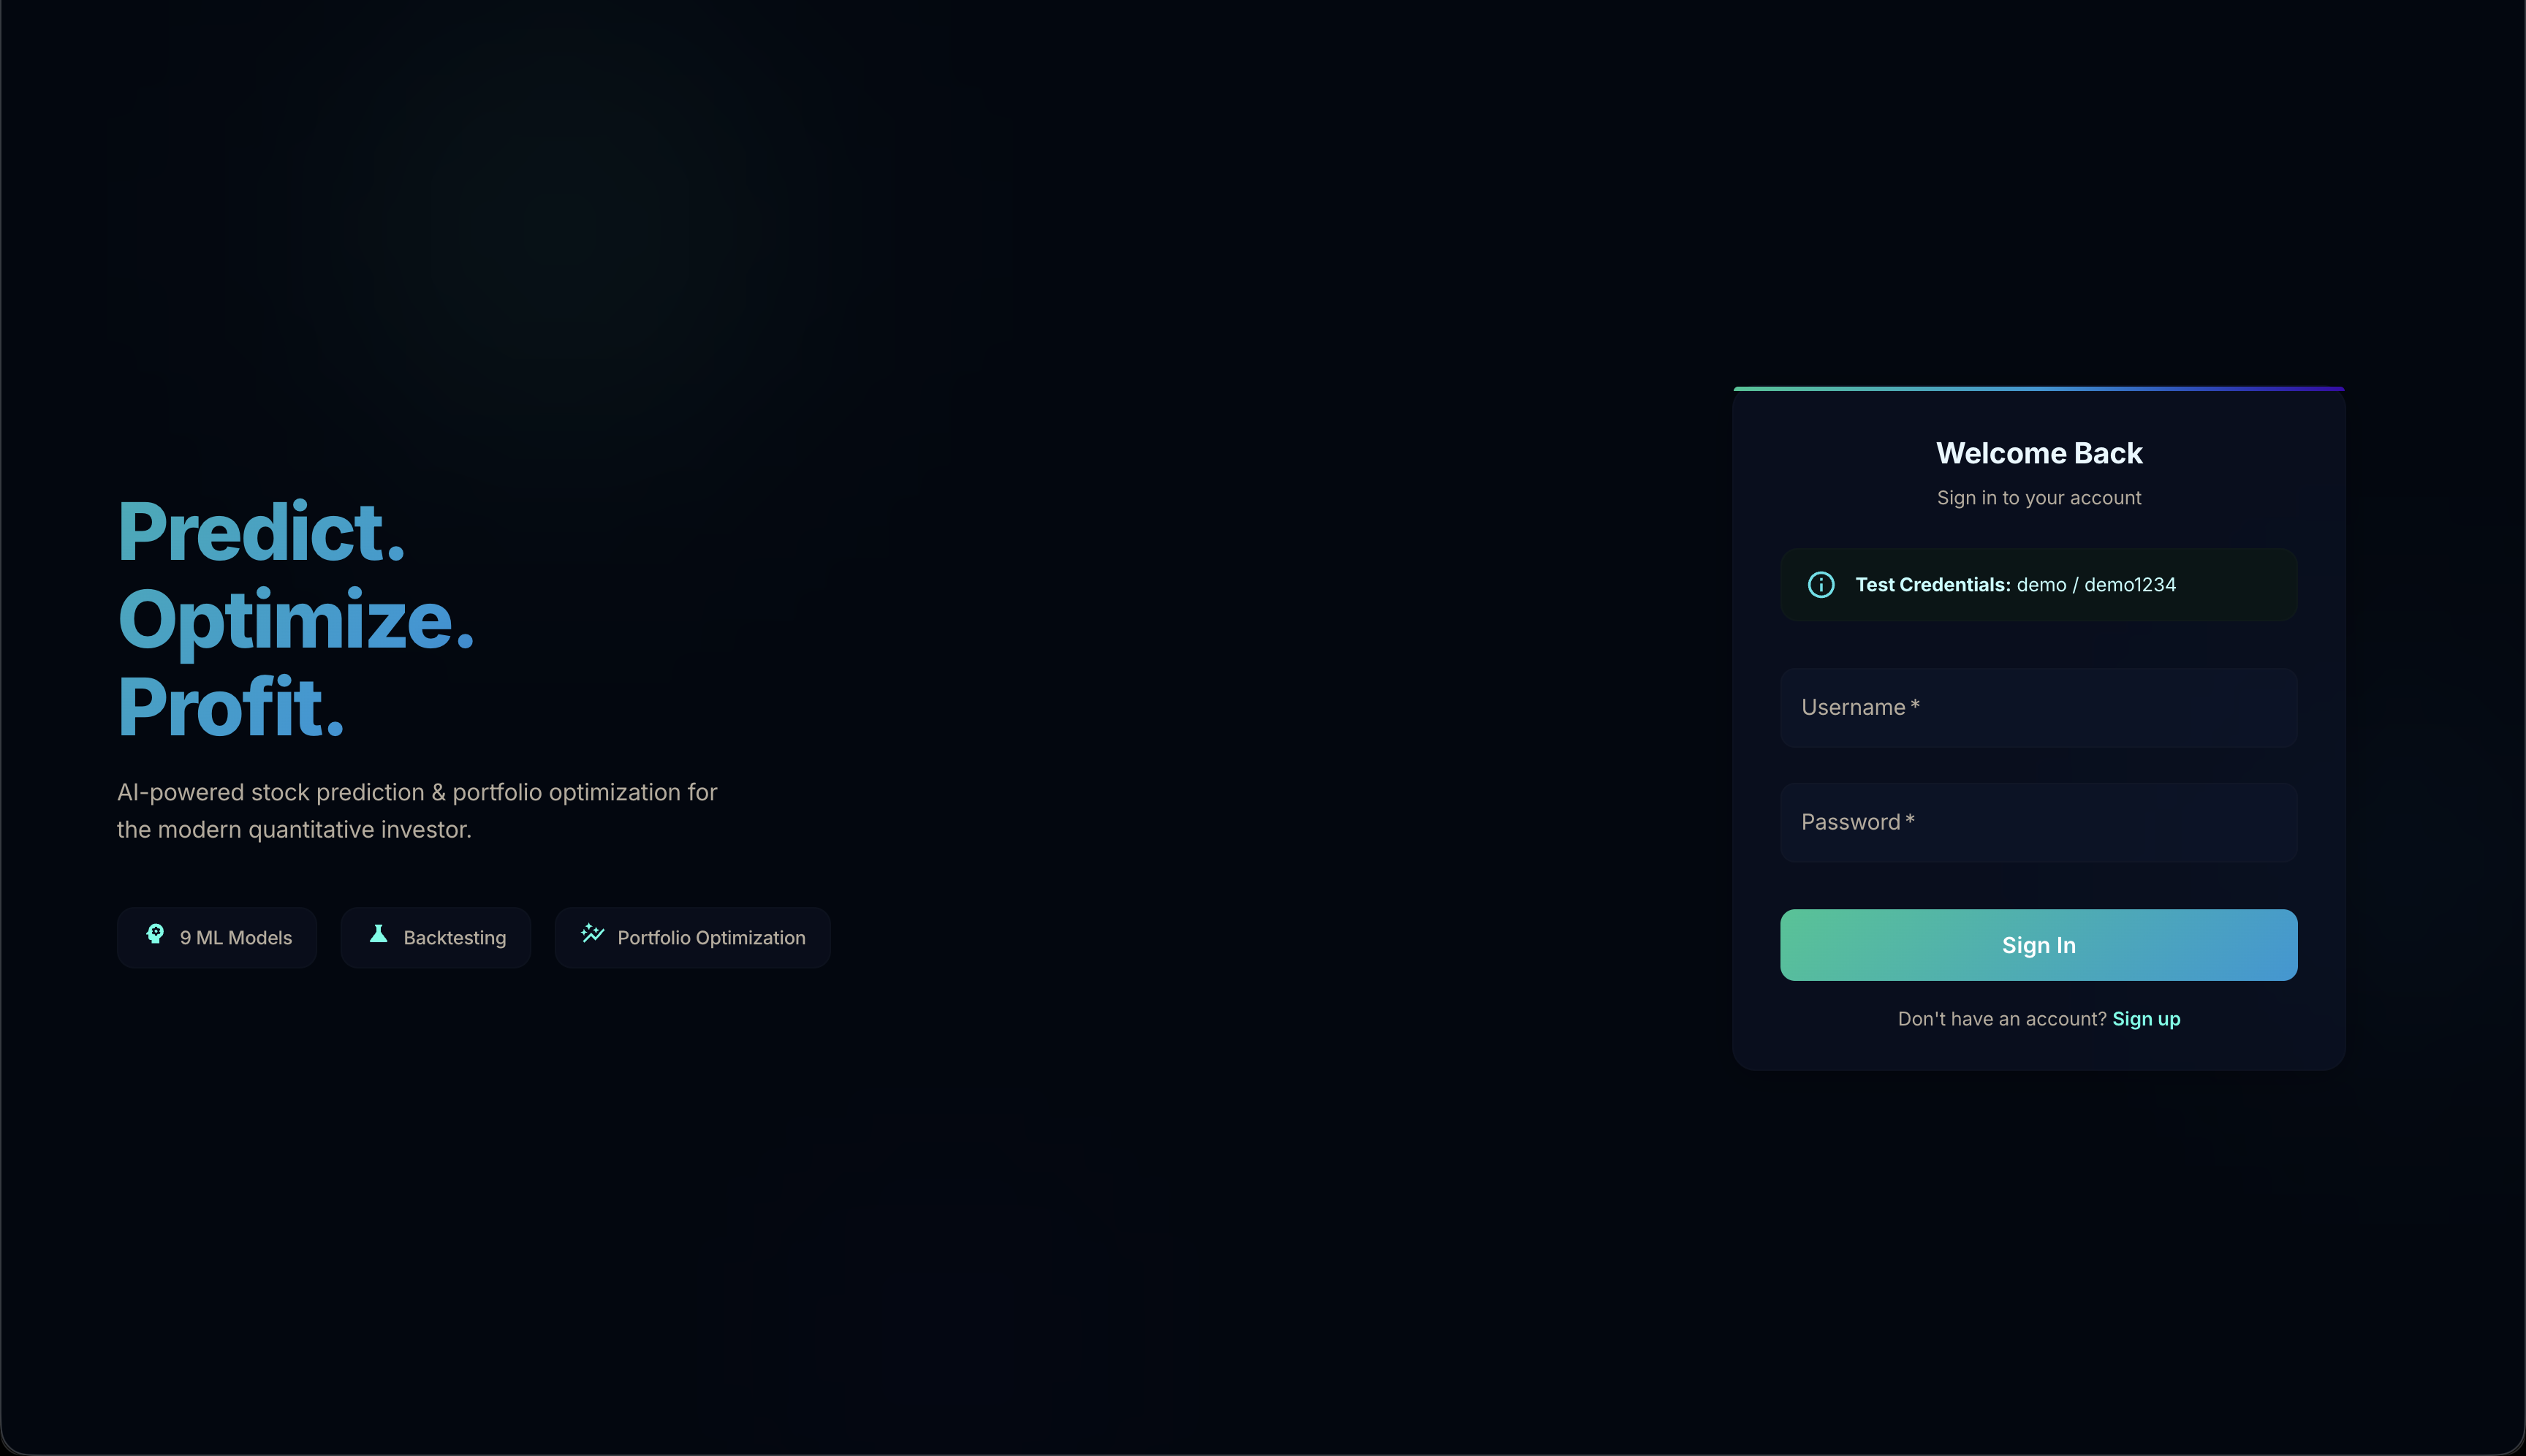
Platform research dashboard
Research dashboard
Analytics and prediction workflow
Analytics workflow
Technical indicators and model insight views
Indicators & model insight
Portfolio optimization and risk analytics
Optimization & risk
Backtesting engine and strategy reporting
Backtest engine
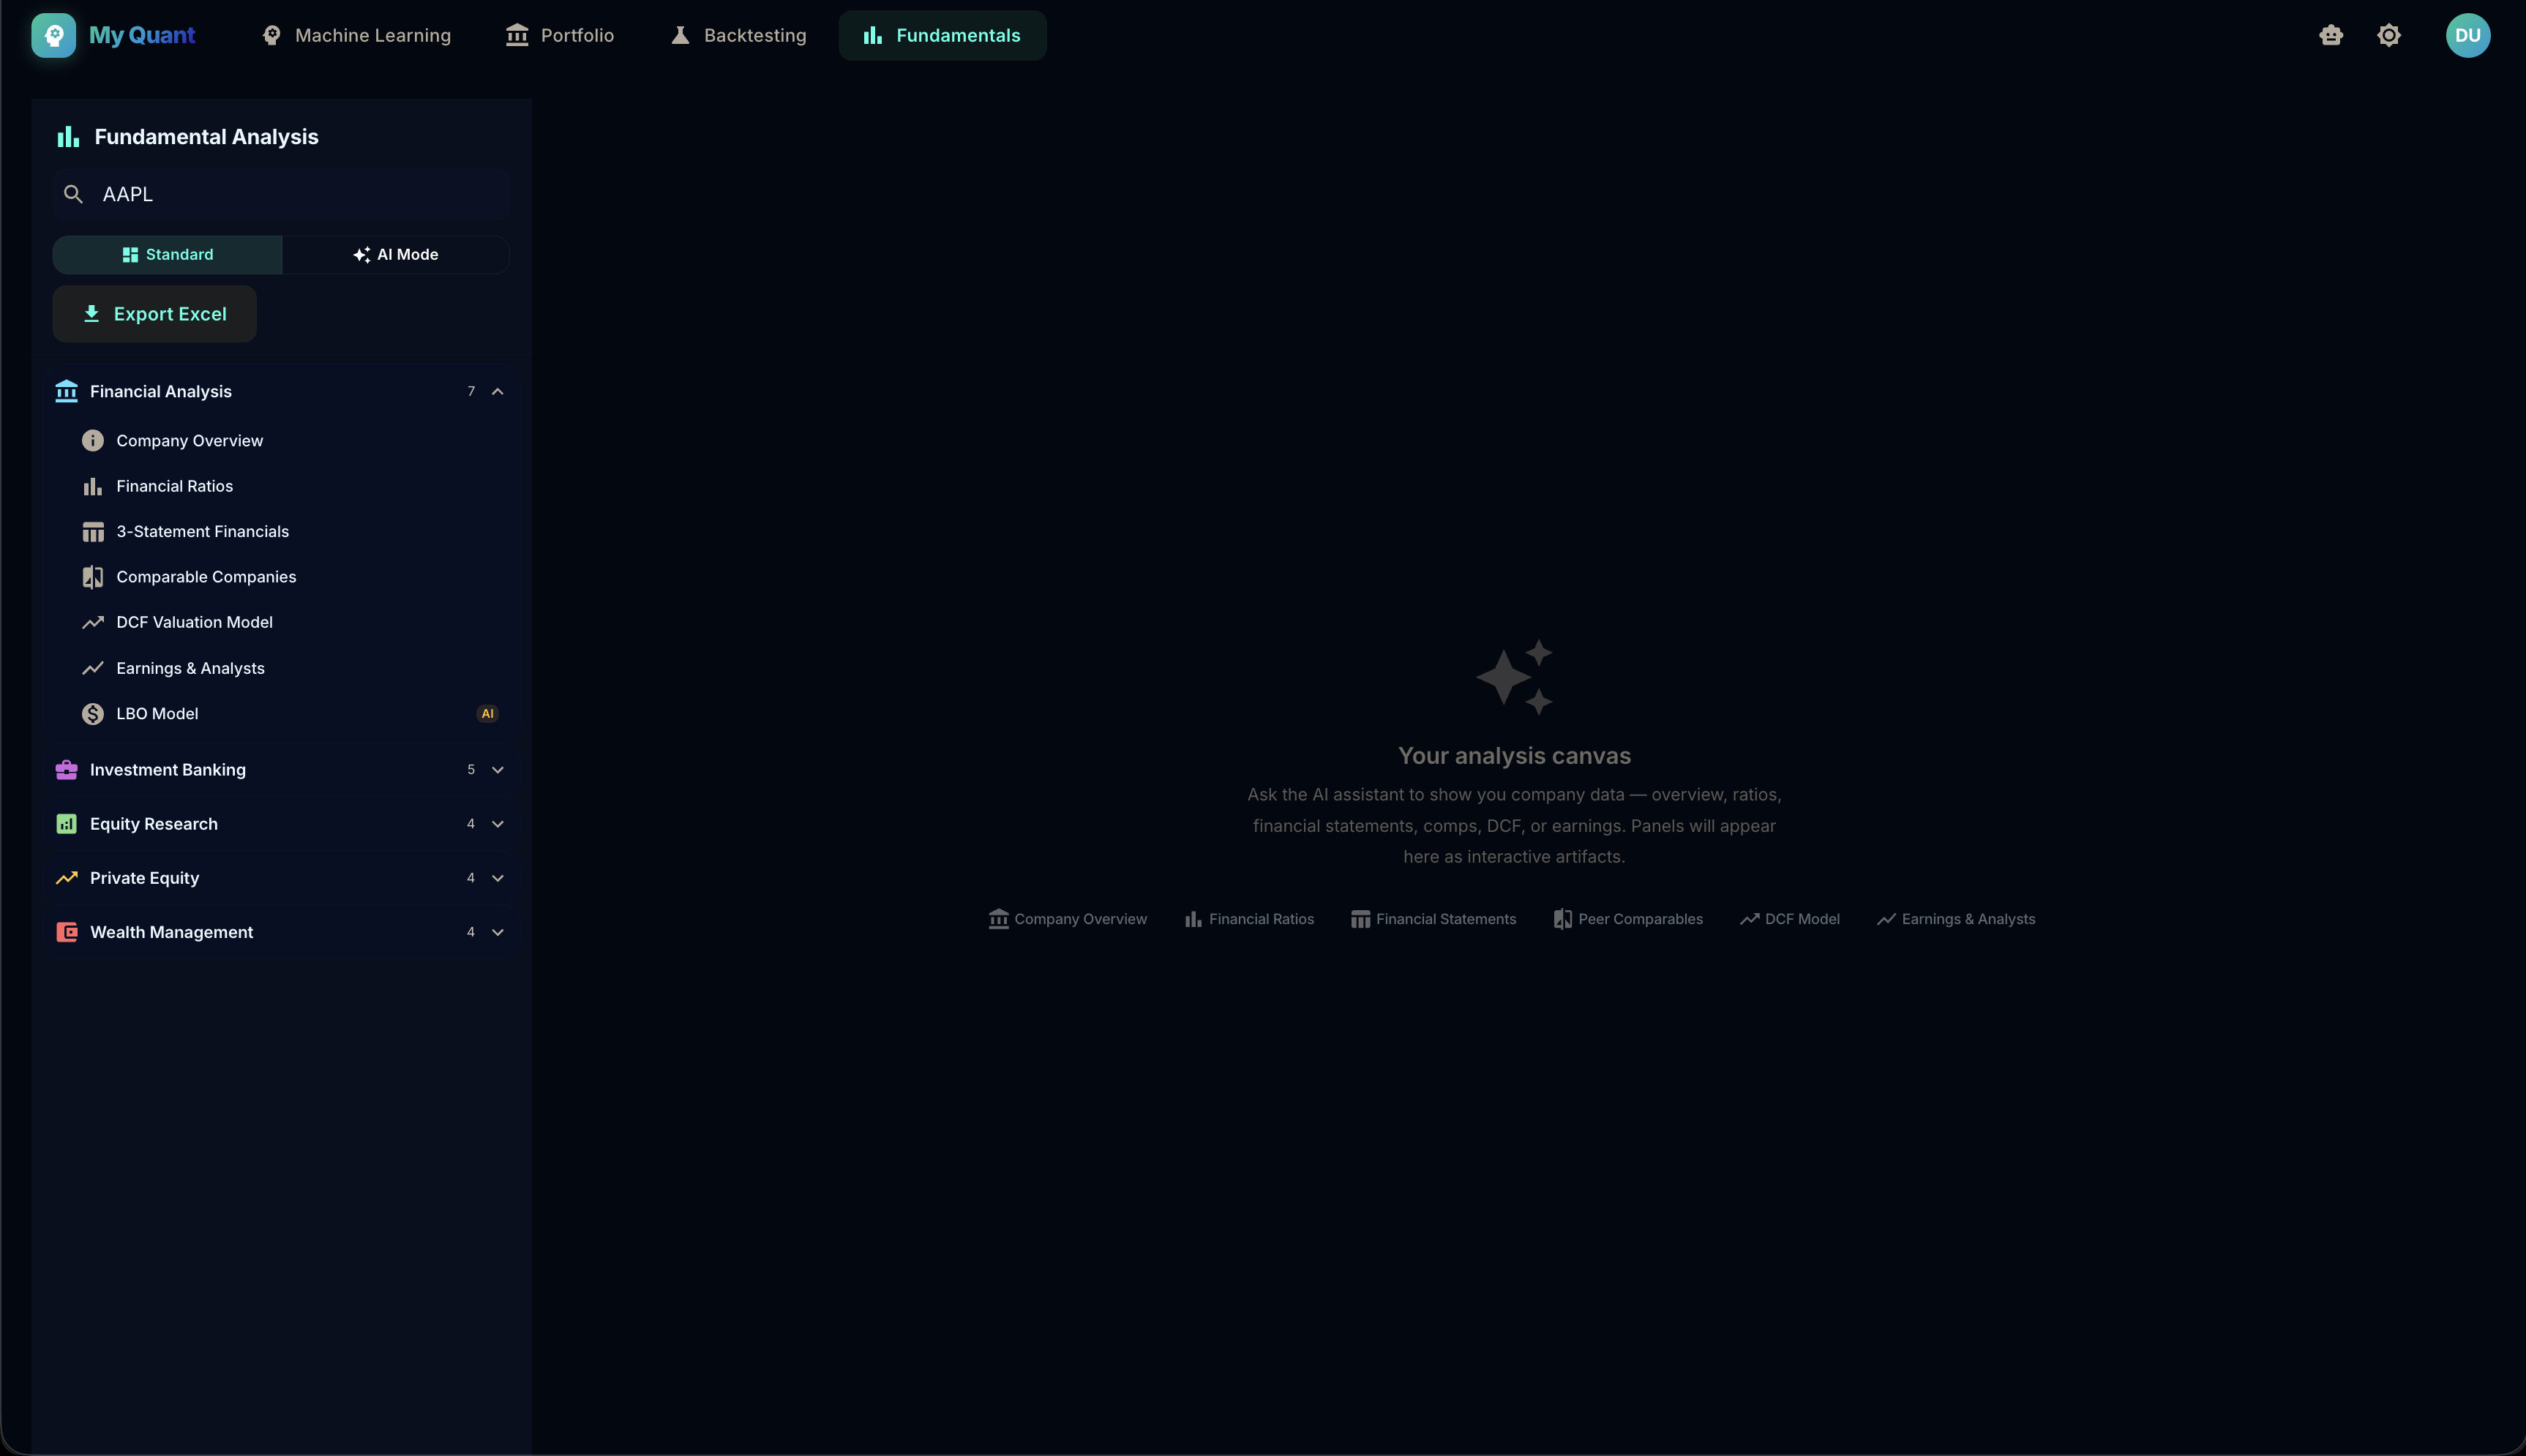
Fundamental analysis toolkit
Fundamental toolkit
End-to-end research and execution dashboard
Research to execution
earlier work

Before the quant track

Data engineering, cloud, and BI projects from the MIS degree. They are why the plumbing on the research above didn't need to be learned twice.

ml platform

AWS serverless

FolioLab — Stock Prediction Platform

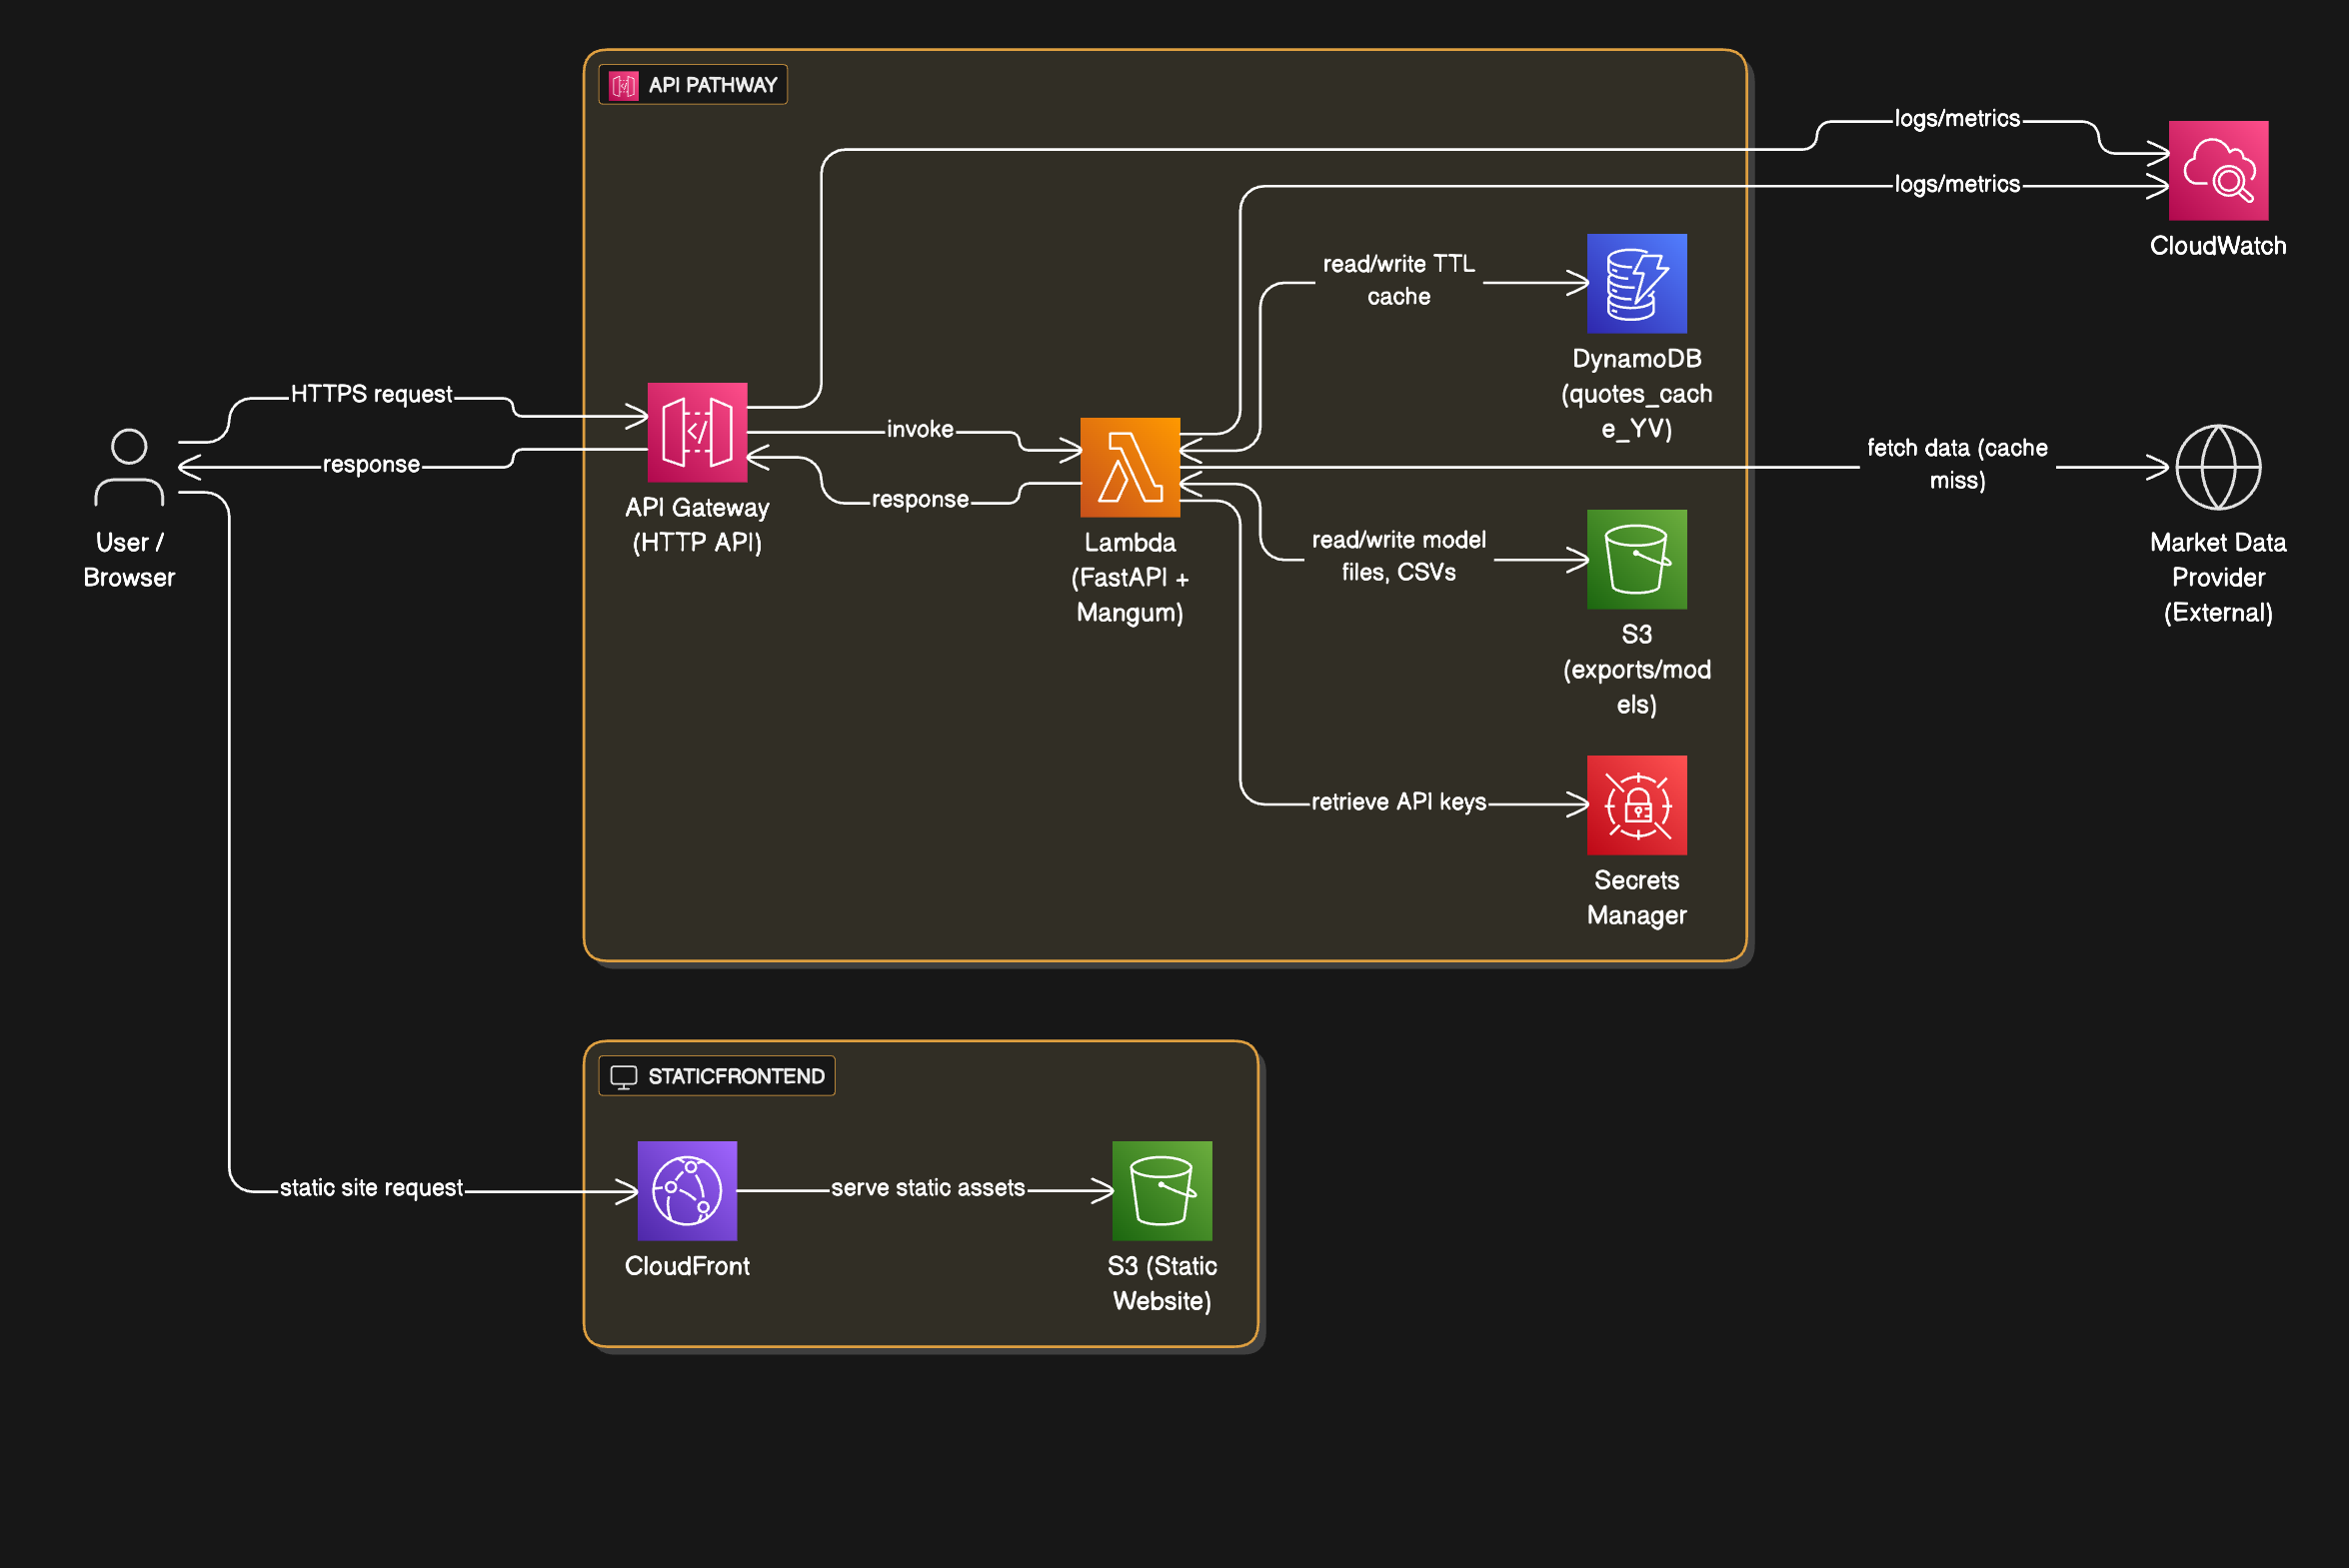
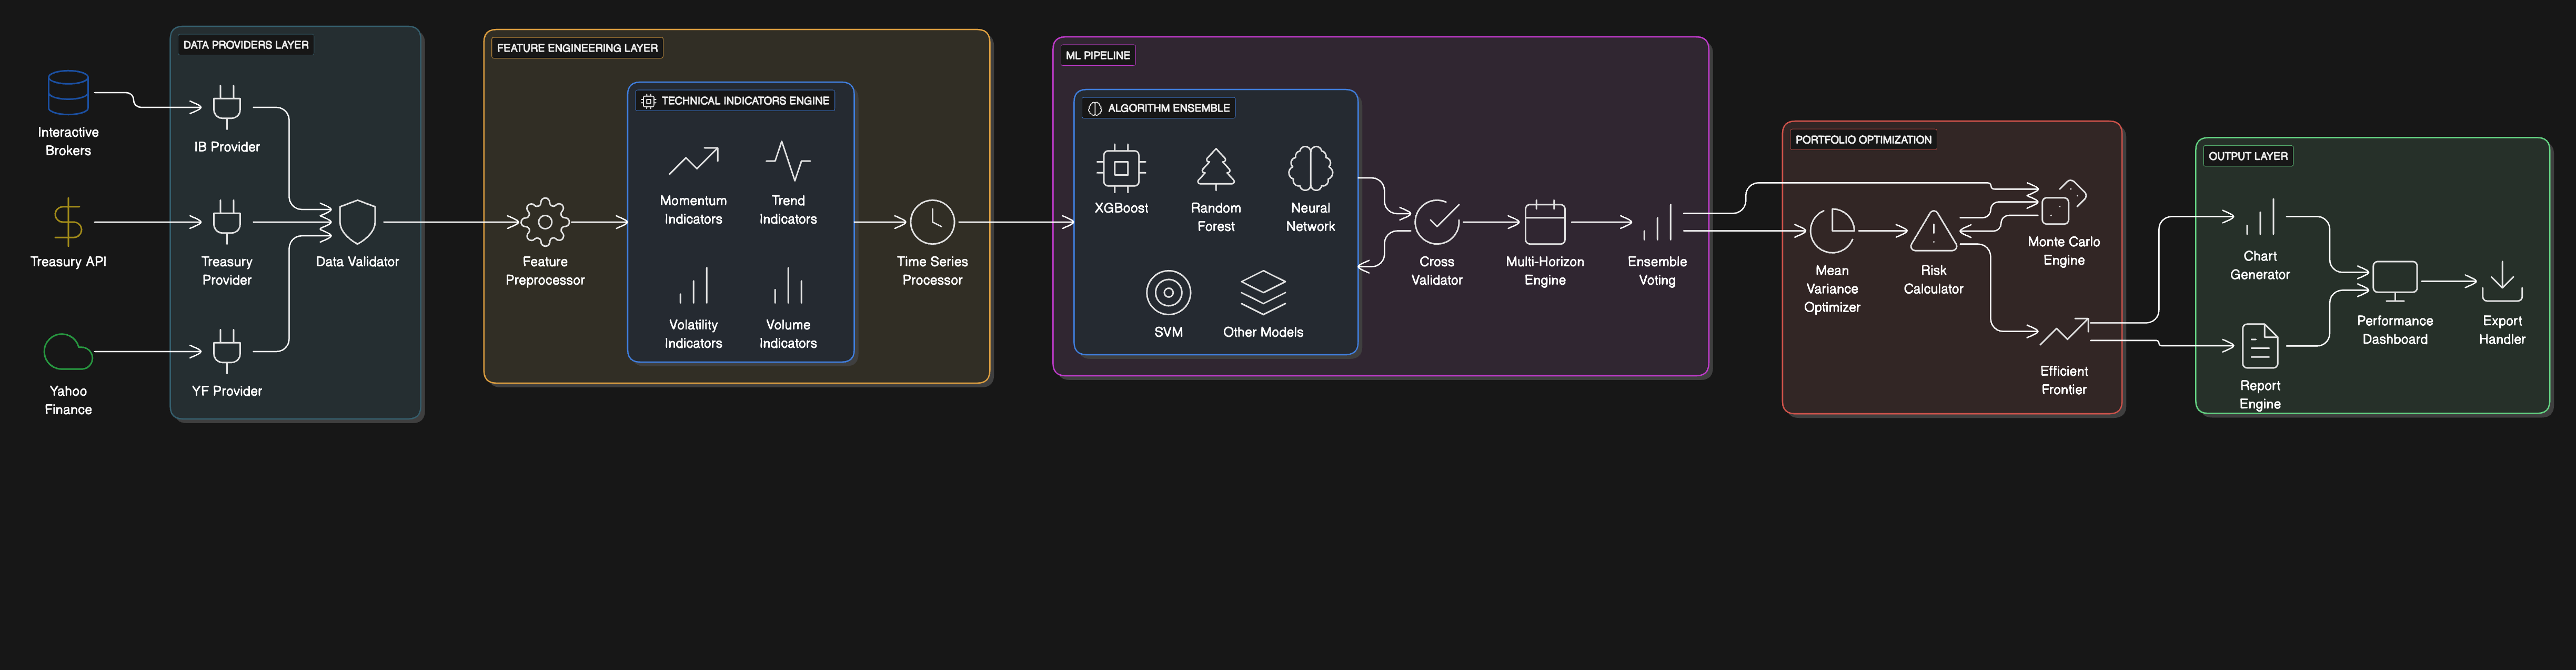
Cloud-native ML platform benchmarking classification models for price direction across 23+ technical indicators, with time-series validation, a React and D3.js dashboard, backtesting with transaction-cost modeling, and Interactive Brokers paper-trading integration. Deployed on AWS Lambda, API Gateway, DynamoDB, S3, and CloudFront.

FolioLab AWS serverless architecture
Cloud architecture
ML pipeline architecture
ML pipeline
Portfolio analytics dashboard
Portfolio analytics
Trading interface
Trading interface
Horizon chart of time series patterns
Horizon chart
housing analytics

Python · Tableau

SmartMove — County-Level Housing vs Cost of Living

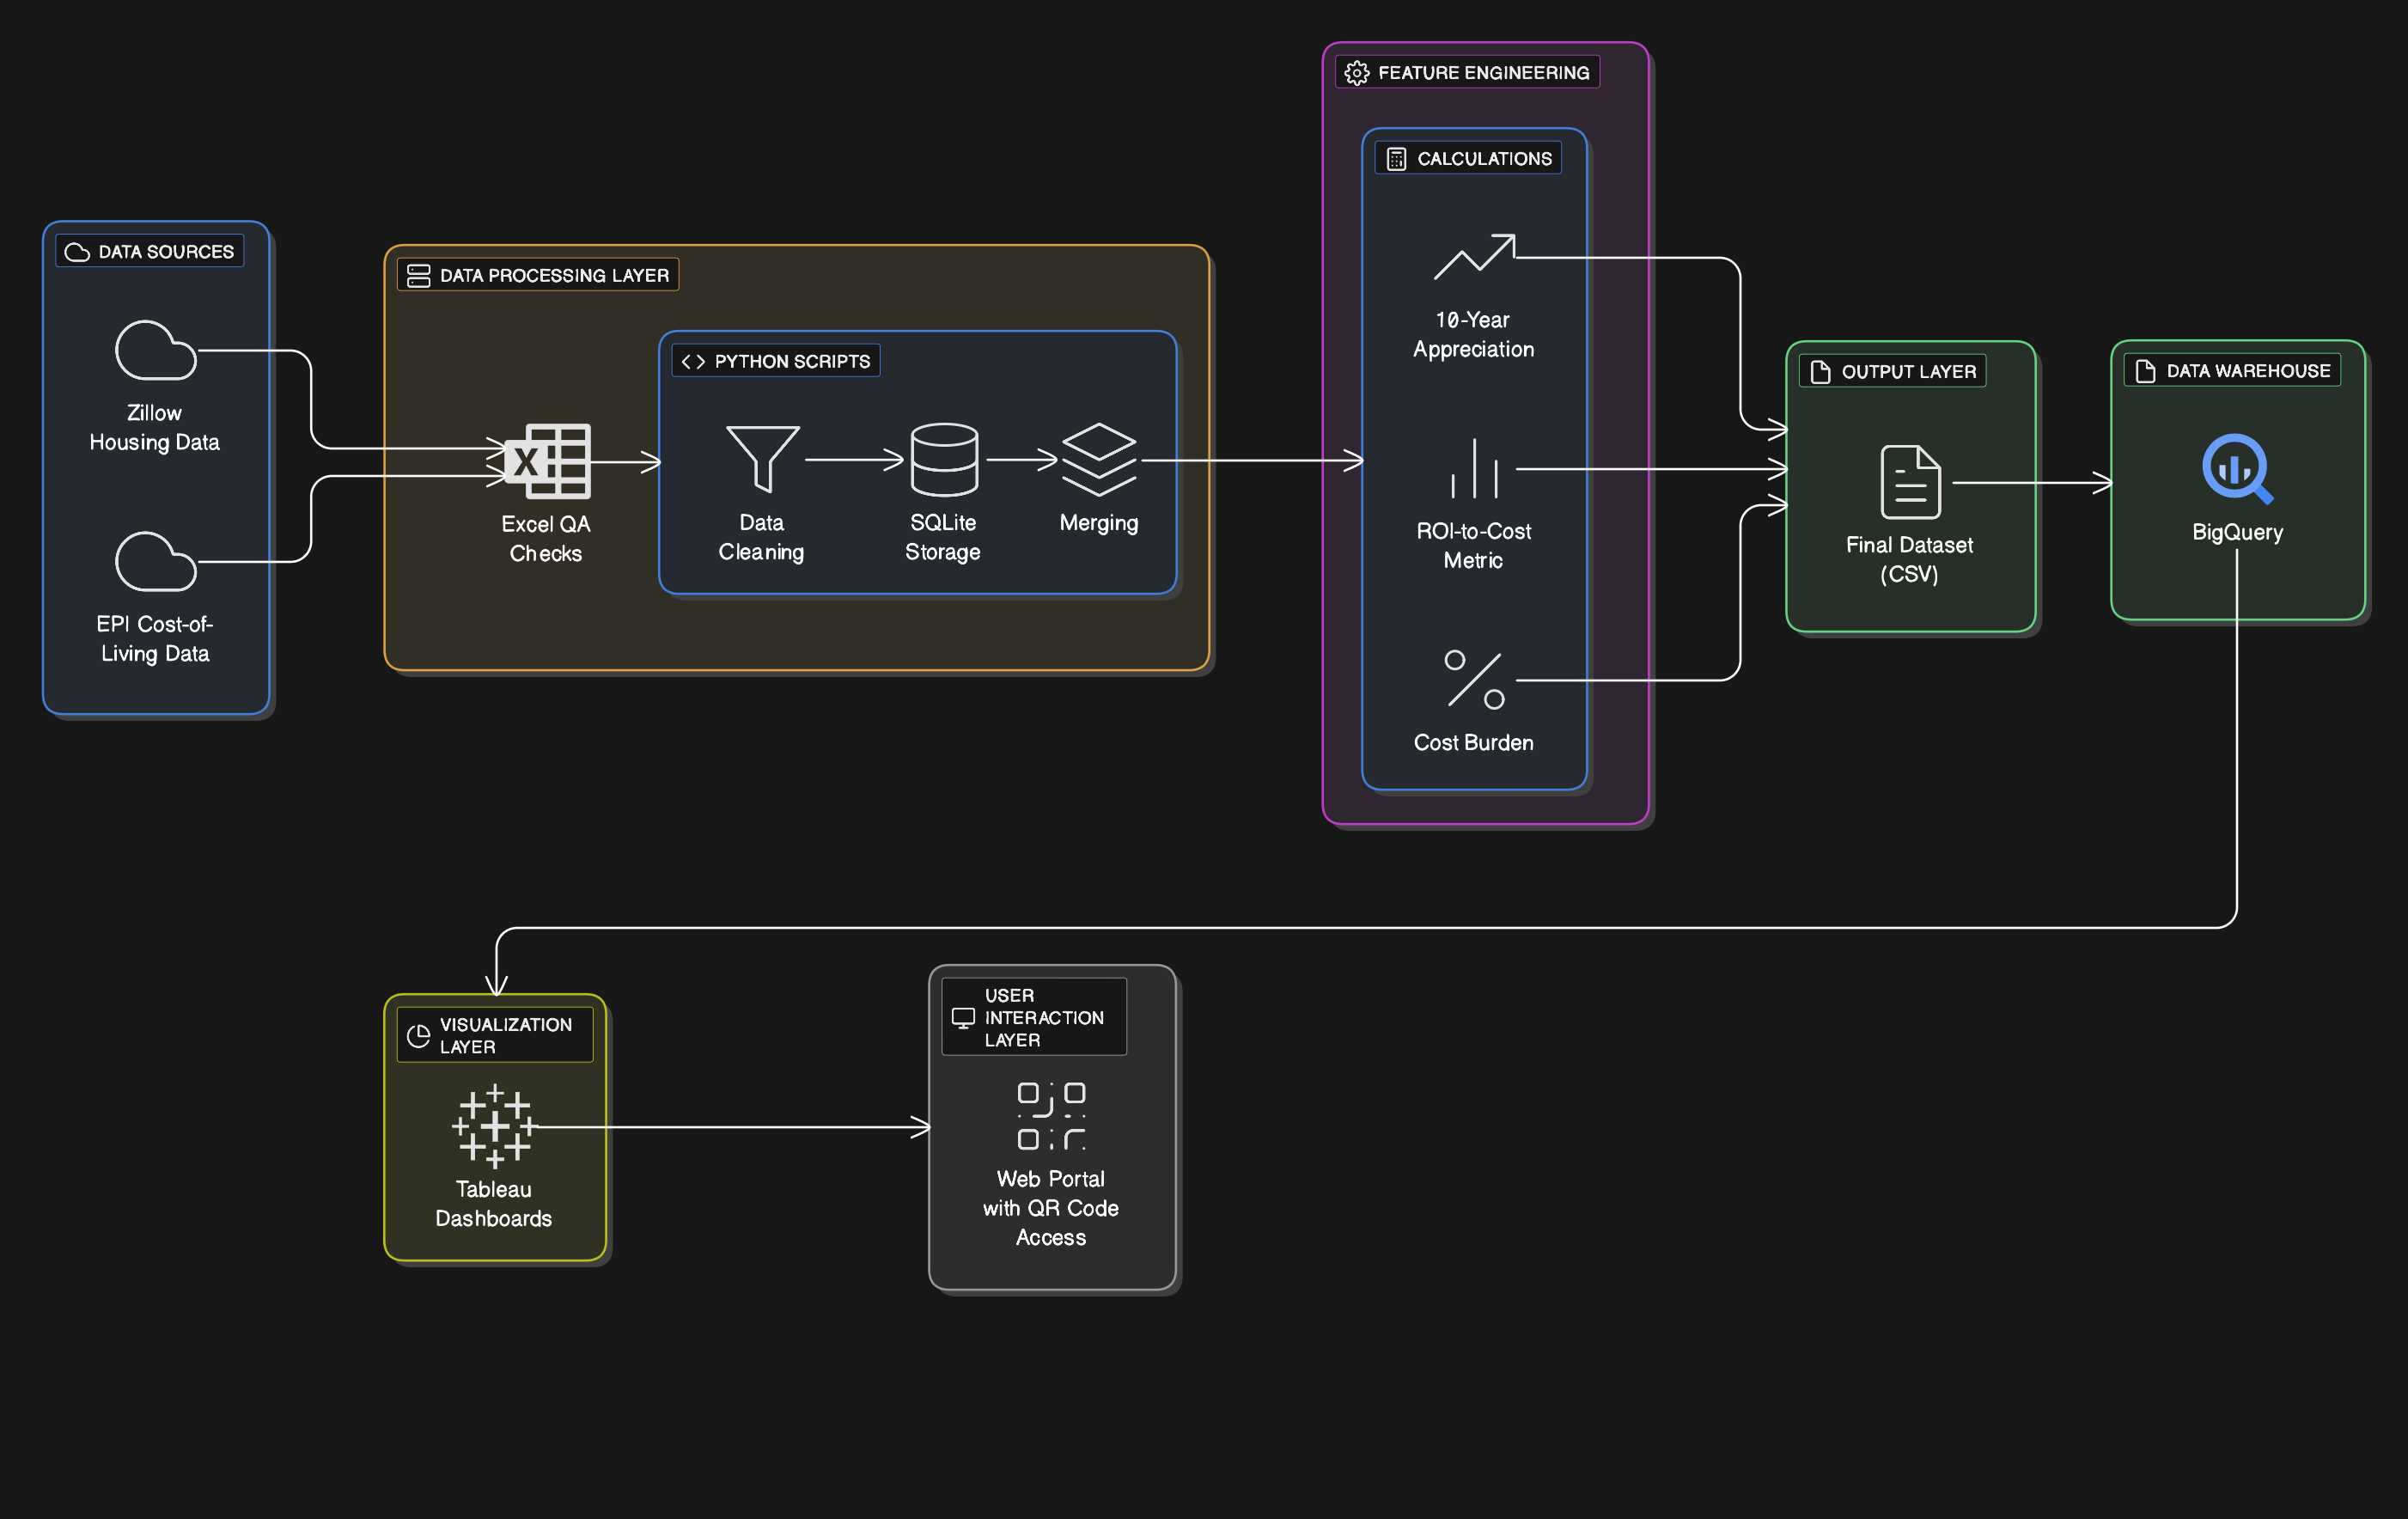
Joined Zillow home values with Economic Policy Institute cost-of-living data across 3,000+ U.S. counties, engineered ROI-to-cost-burden metrics and 10-year appreciation ratios, and shipped 6 interactive Tableau dashboards with maps, filters, and rankings.

SmartMove data pipeline and dashboard architecture
Pipeline & dashboard
data engineering

AWS · Redshift

E-Commerce Sales Analytics Pipeline

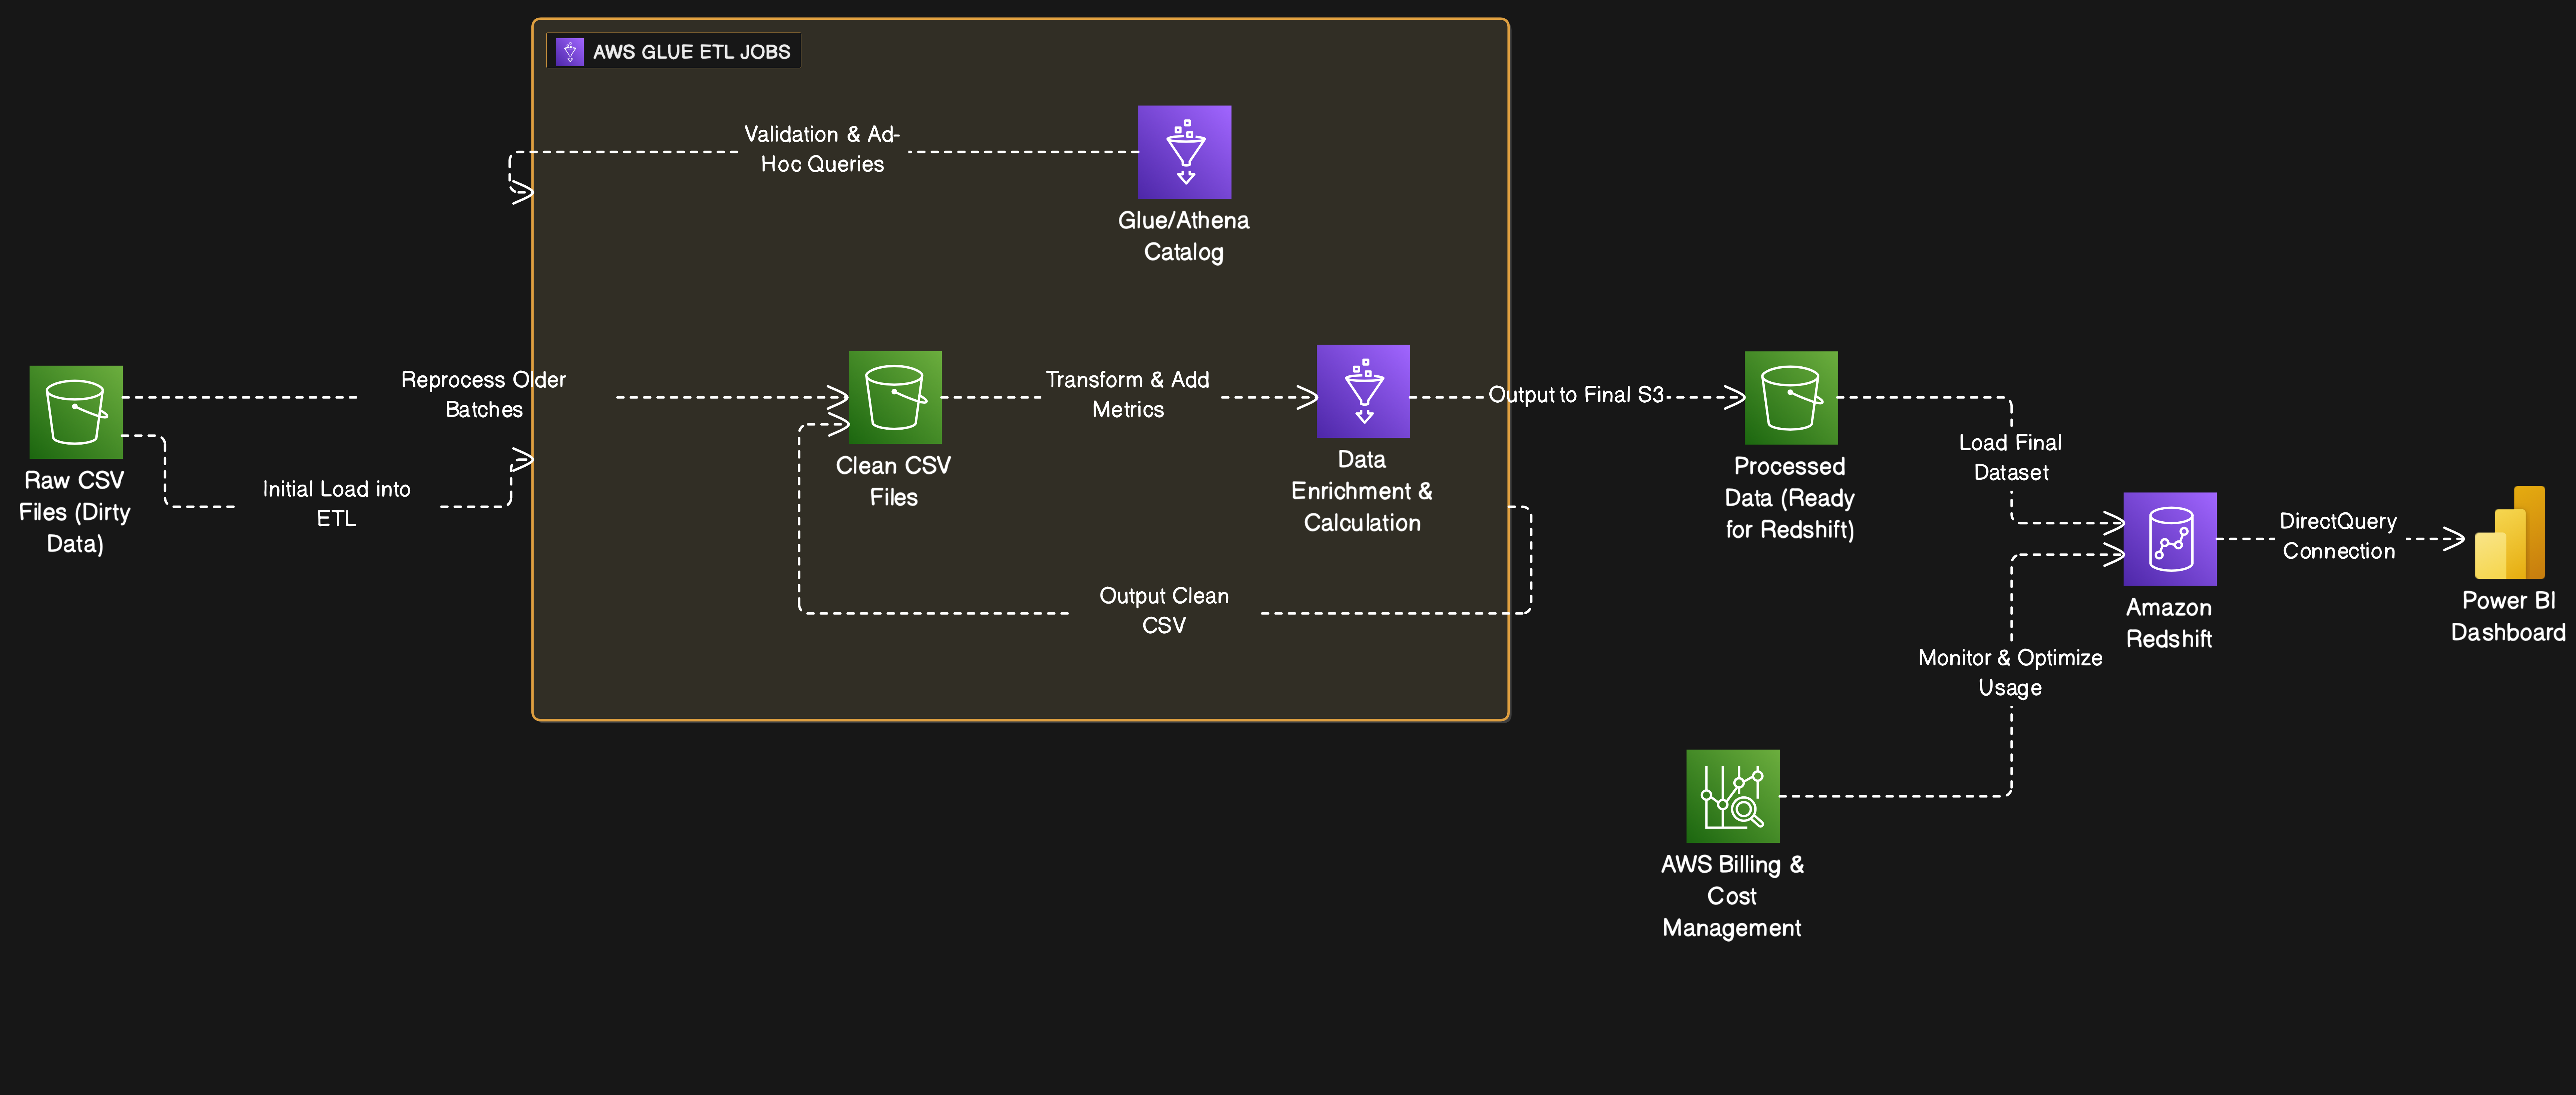
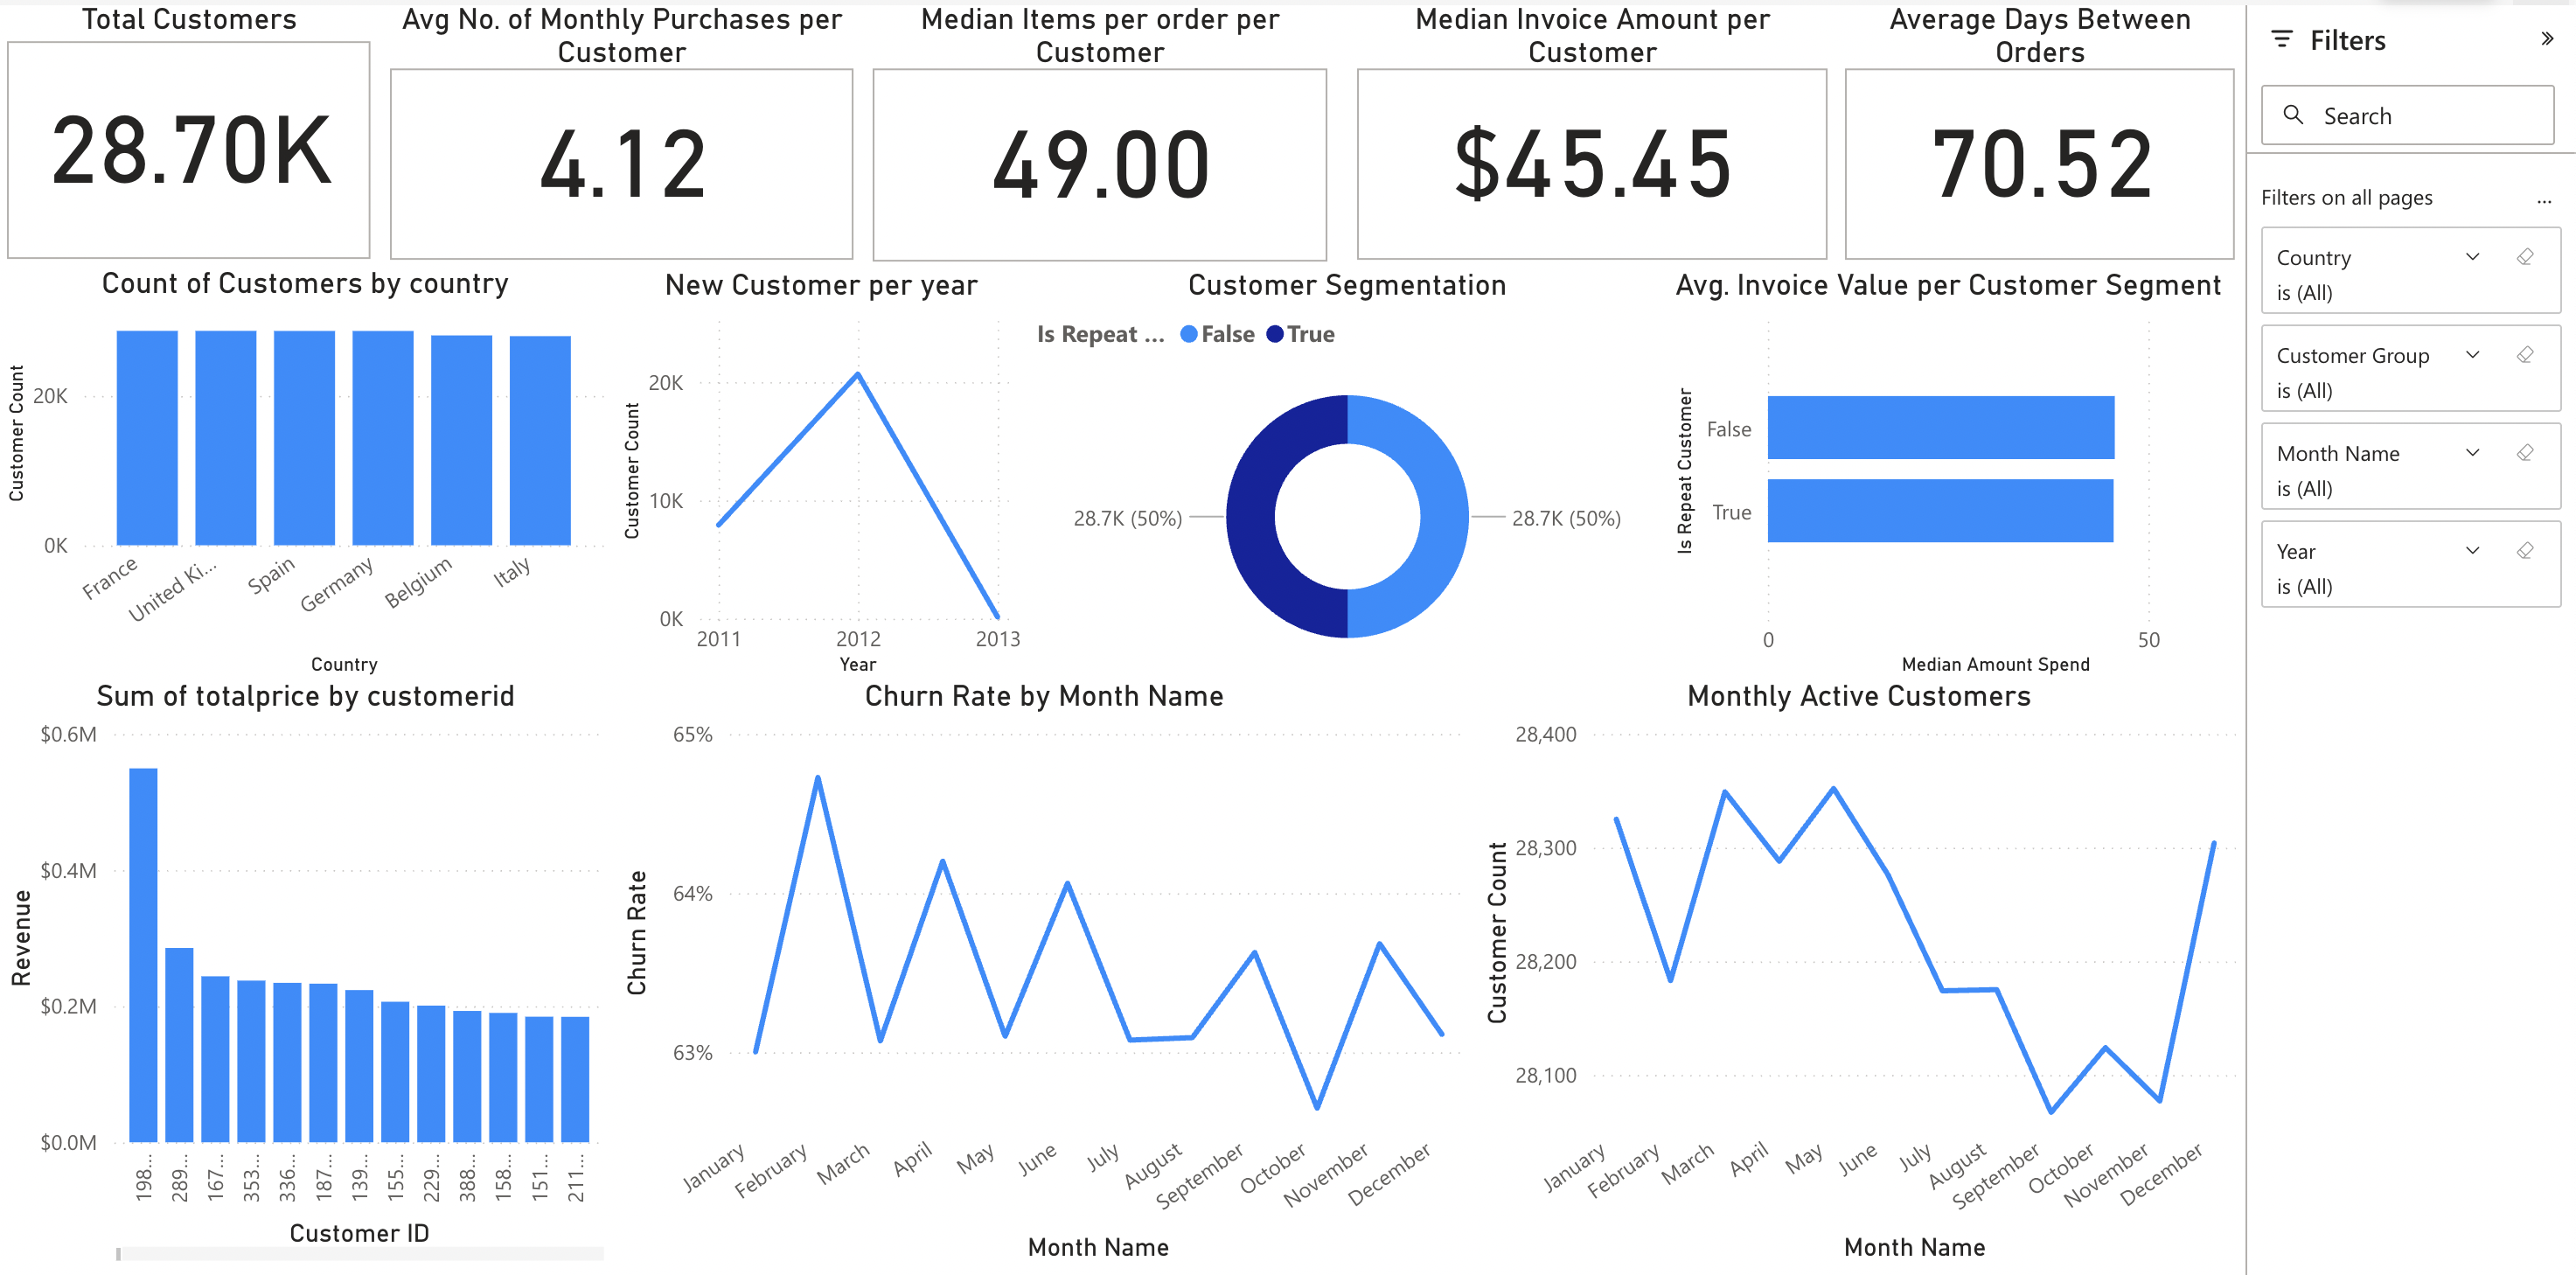
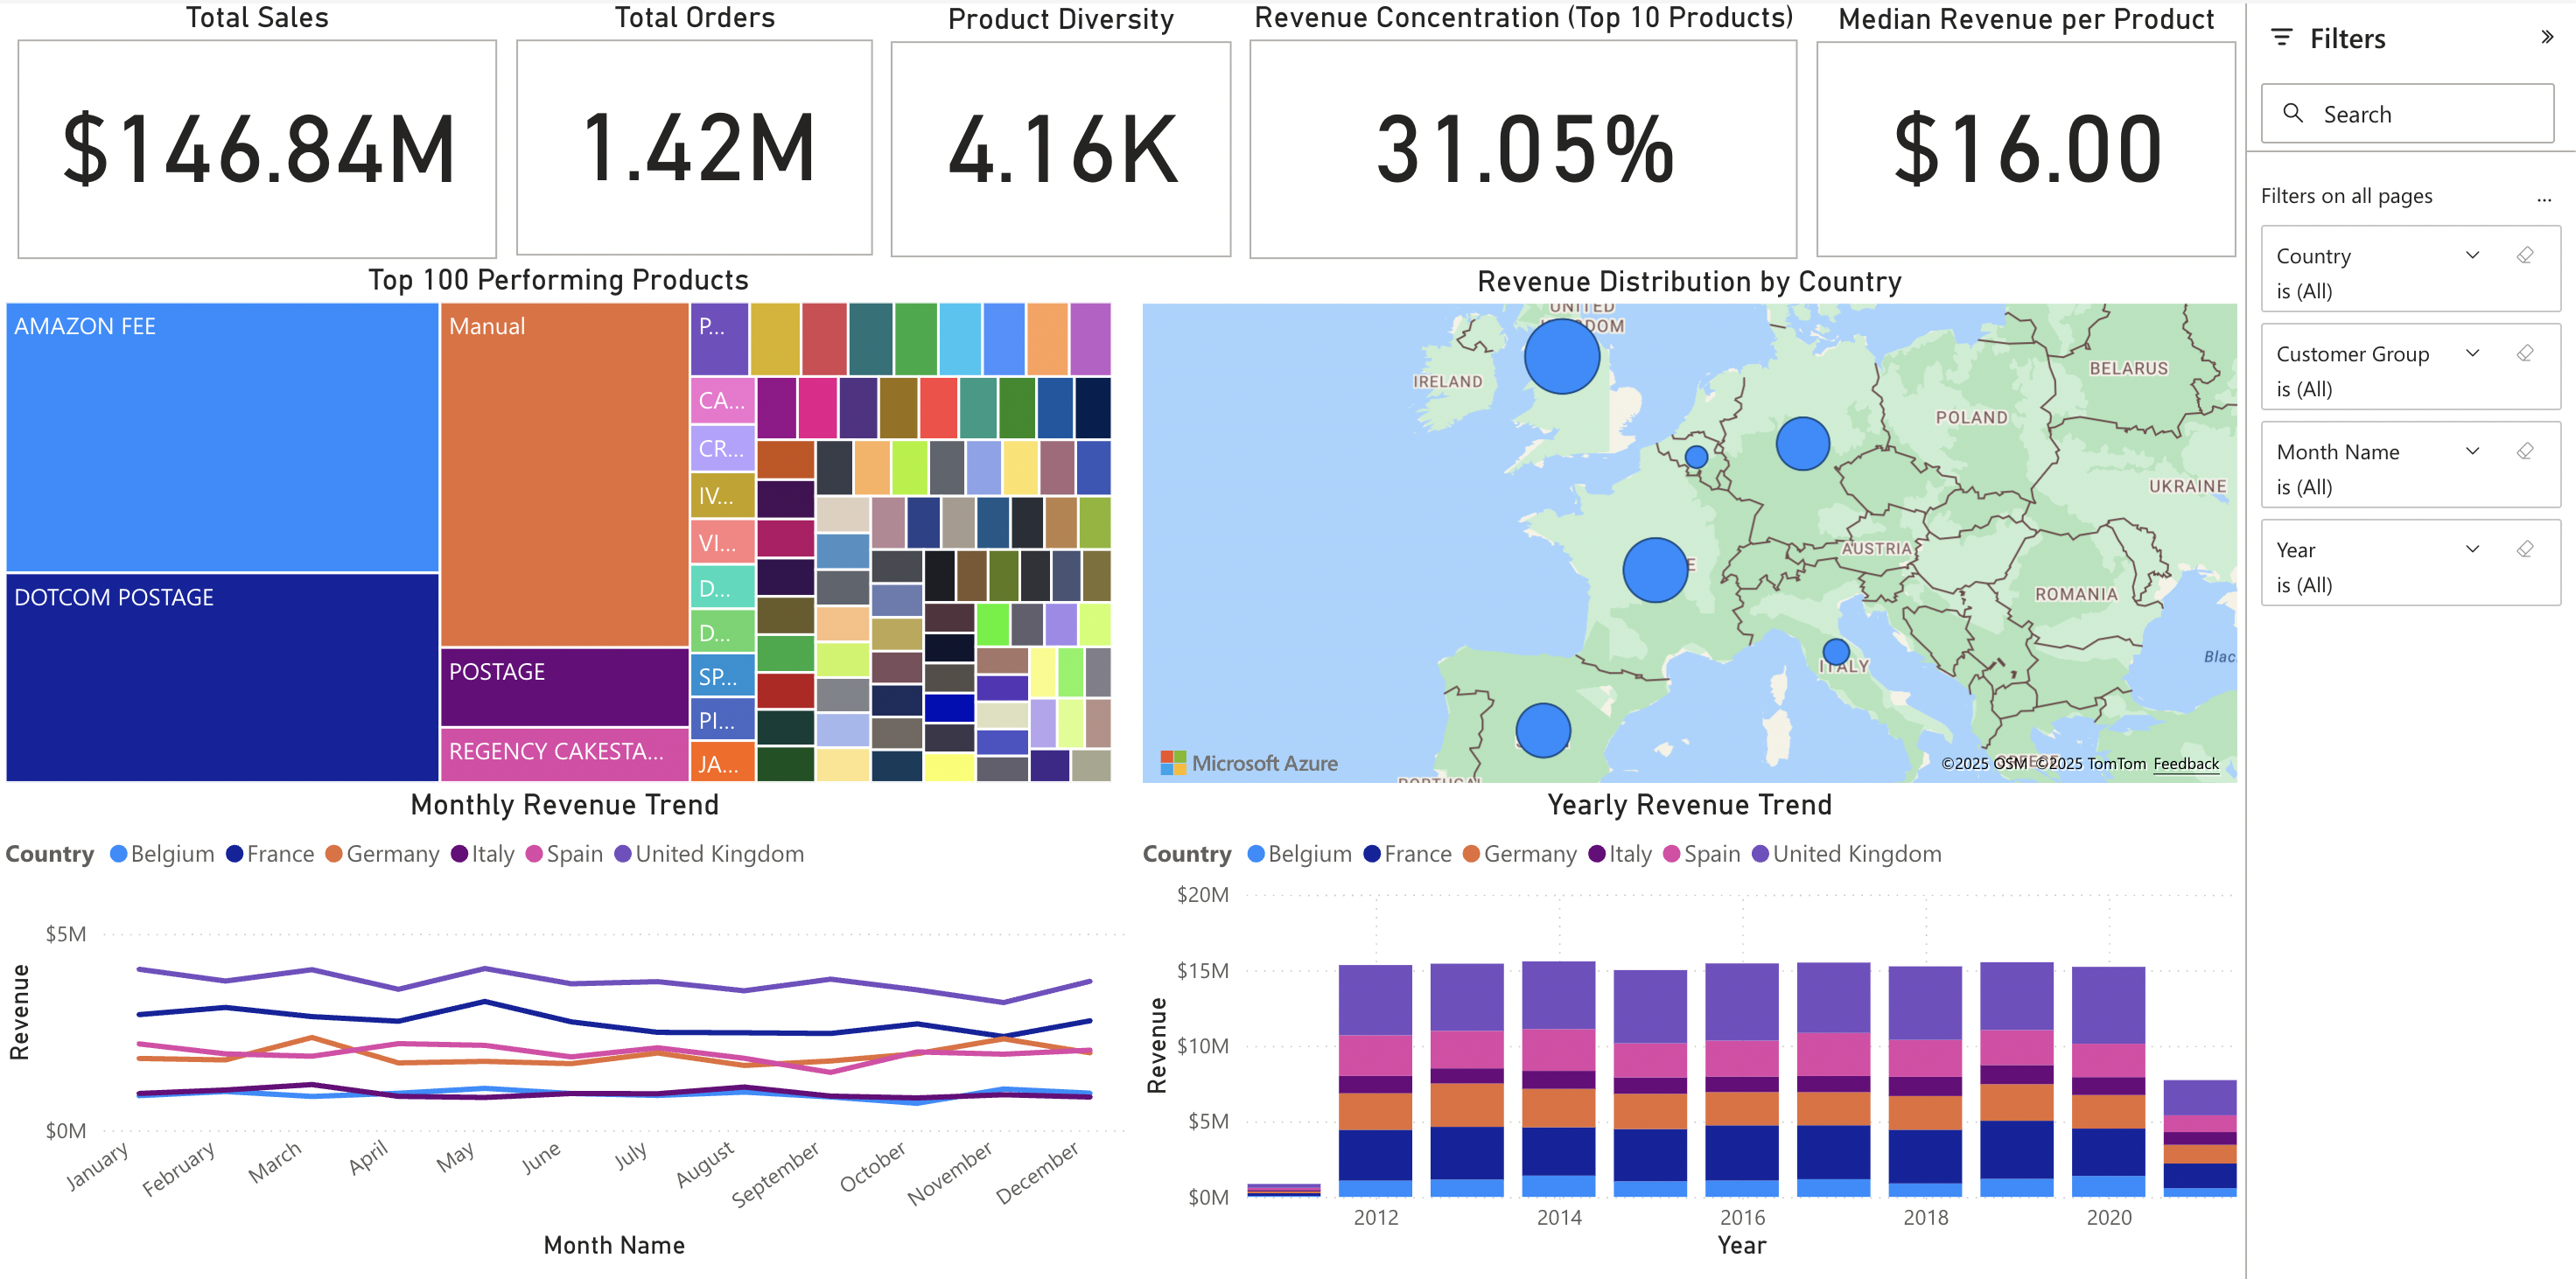
End-to-end AWS pipeline for multi-country sales analysis: raw CSV ingestion to S3, PySpark transformation in AWS Glue, modeling and loading into Redshift, then Tableau and Power BI dashboards that surfaced a 40% Q4 spike and the underperforming regions behind it.

AWS data pipeline architecture
Pipeline architecture
Regional sales performance dashboard
Regional performance
Quarterly KPI dashboard
Quarterly KPIs
QR code linking to the live Power BI dashboard
Live dashboard QR
infrastructure

AWS · Jenkins

Serverless Application & CI/CD Pipeline

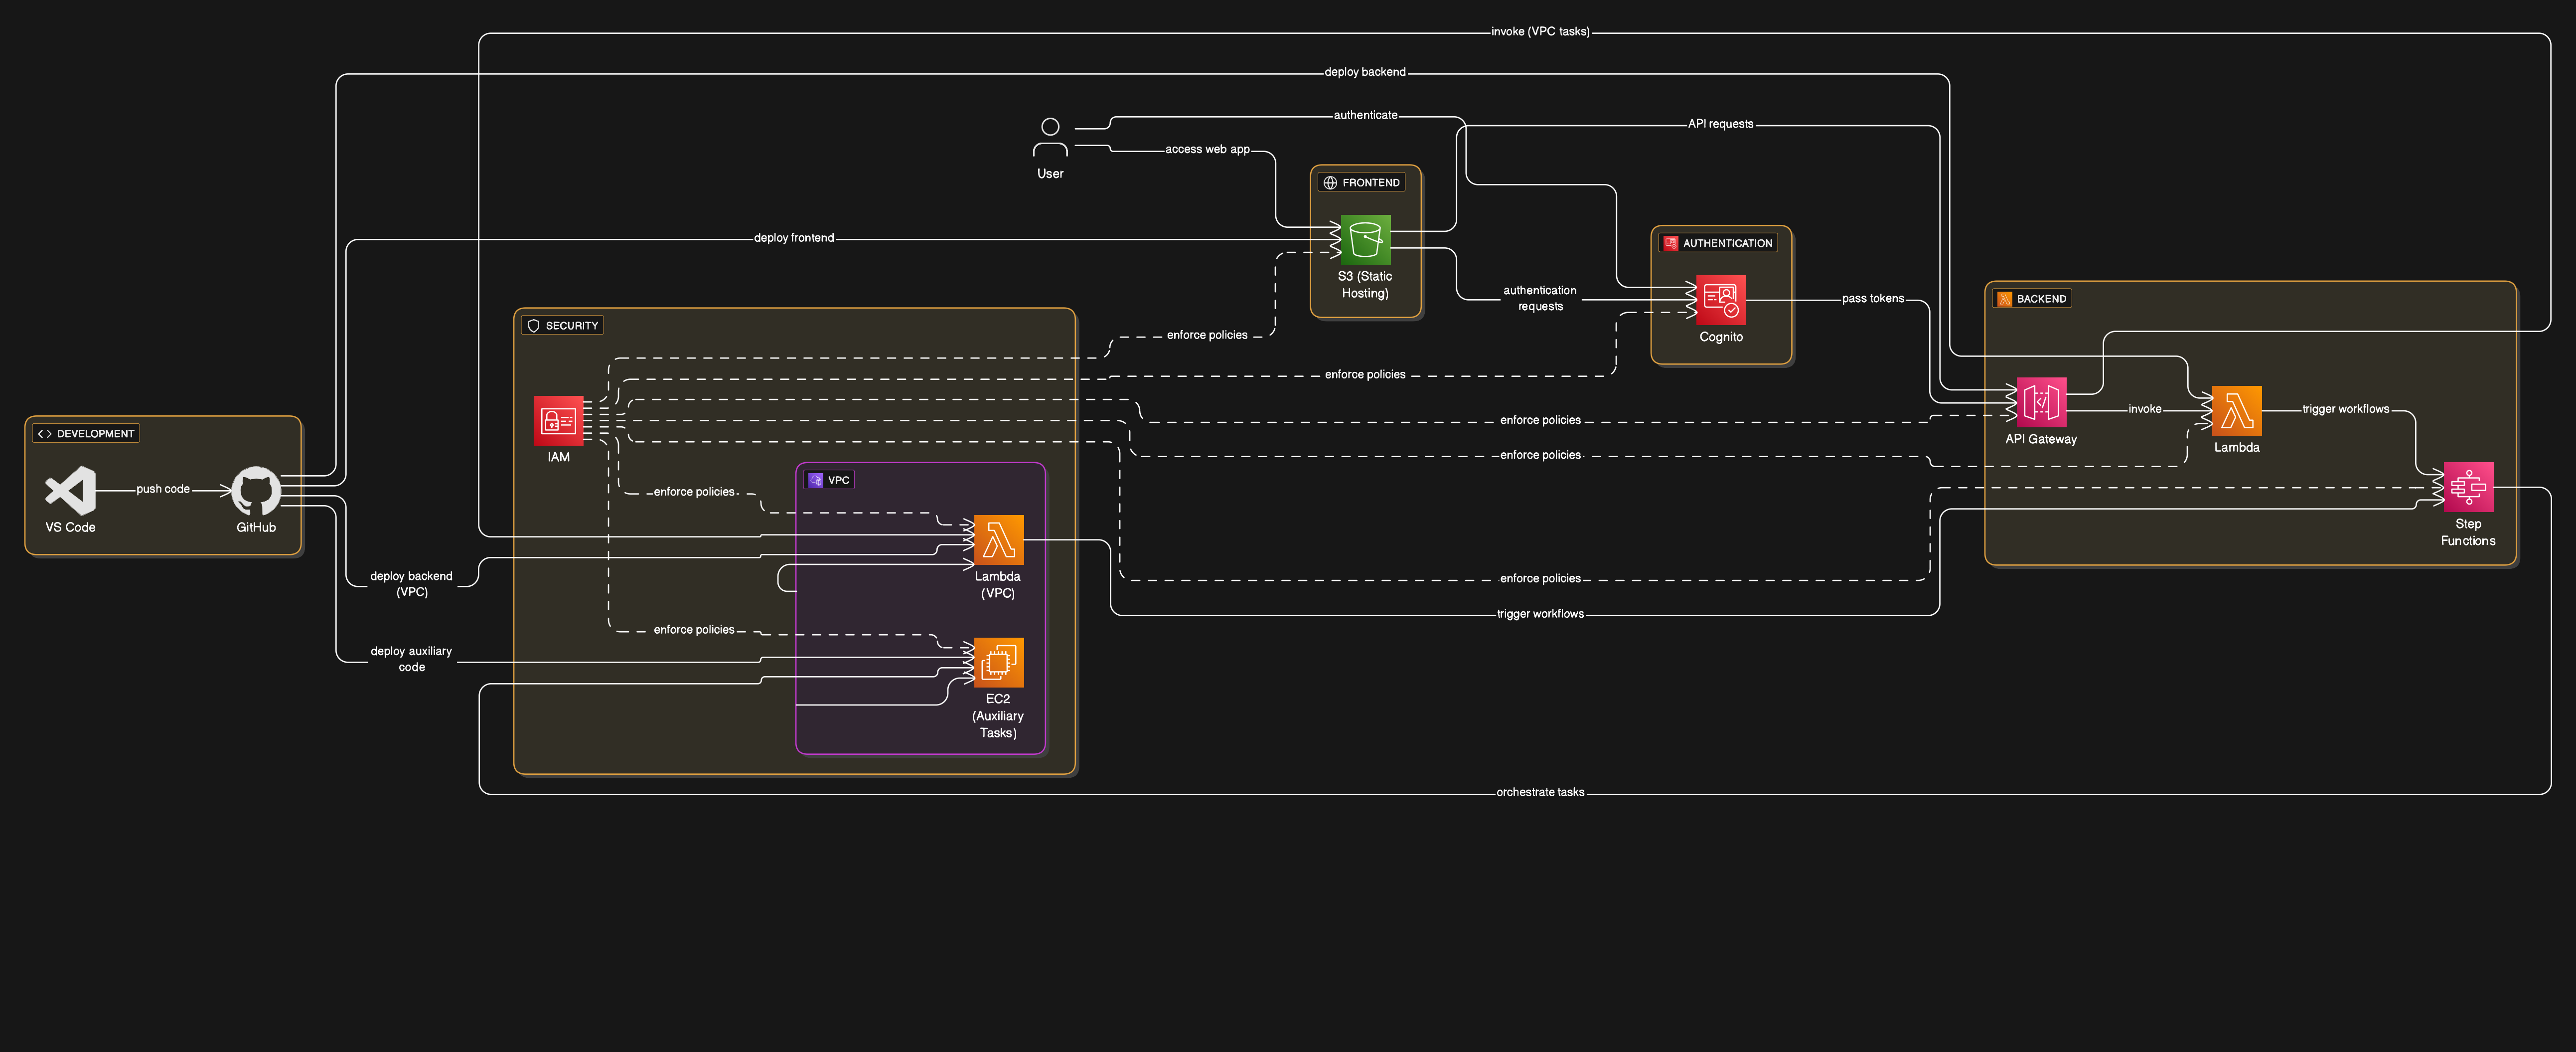
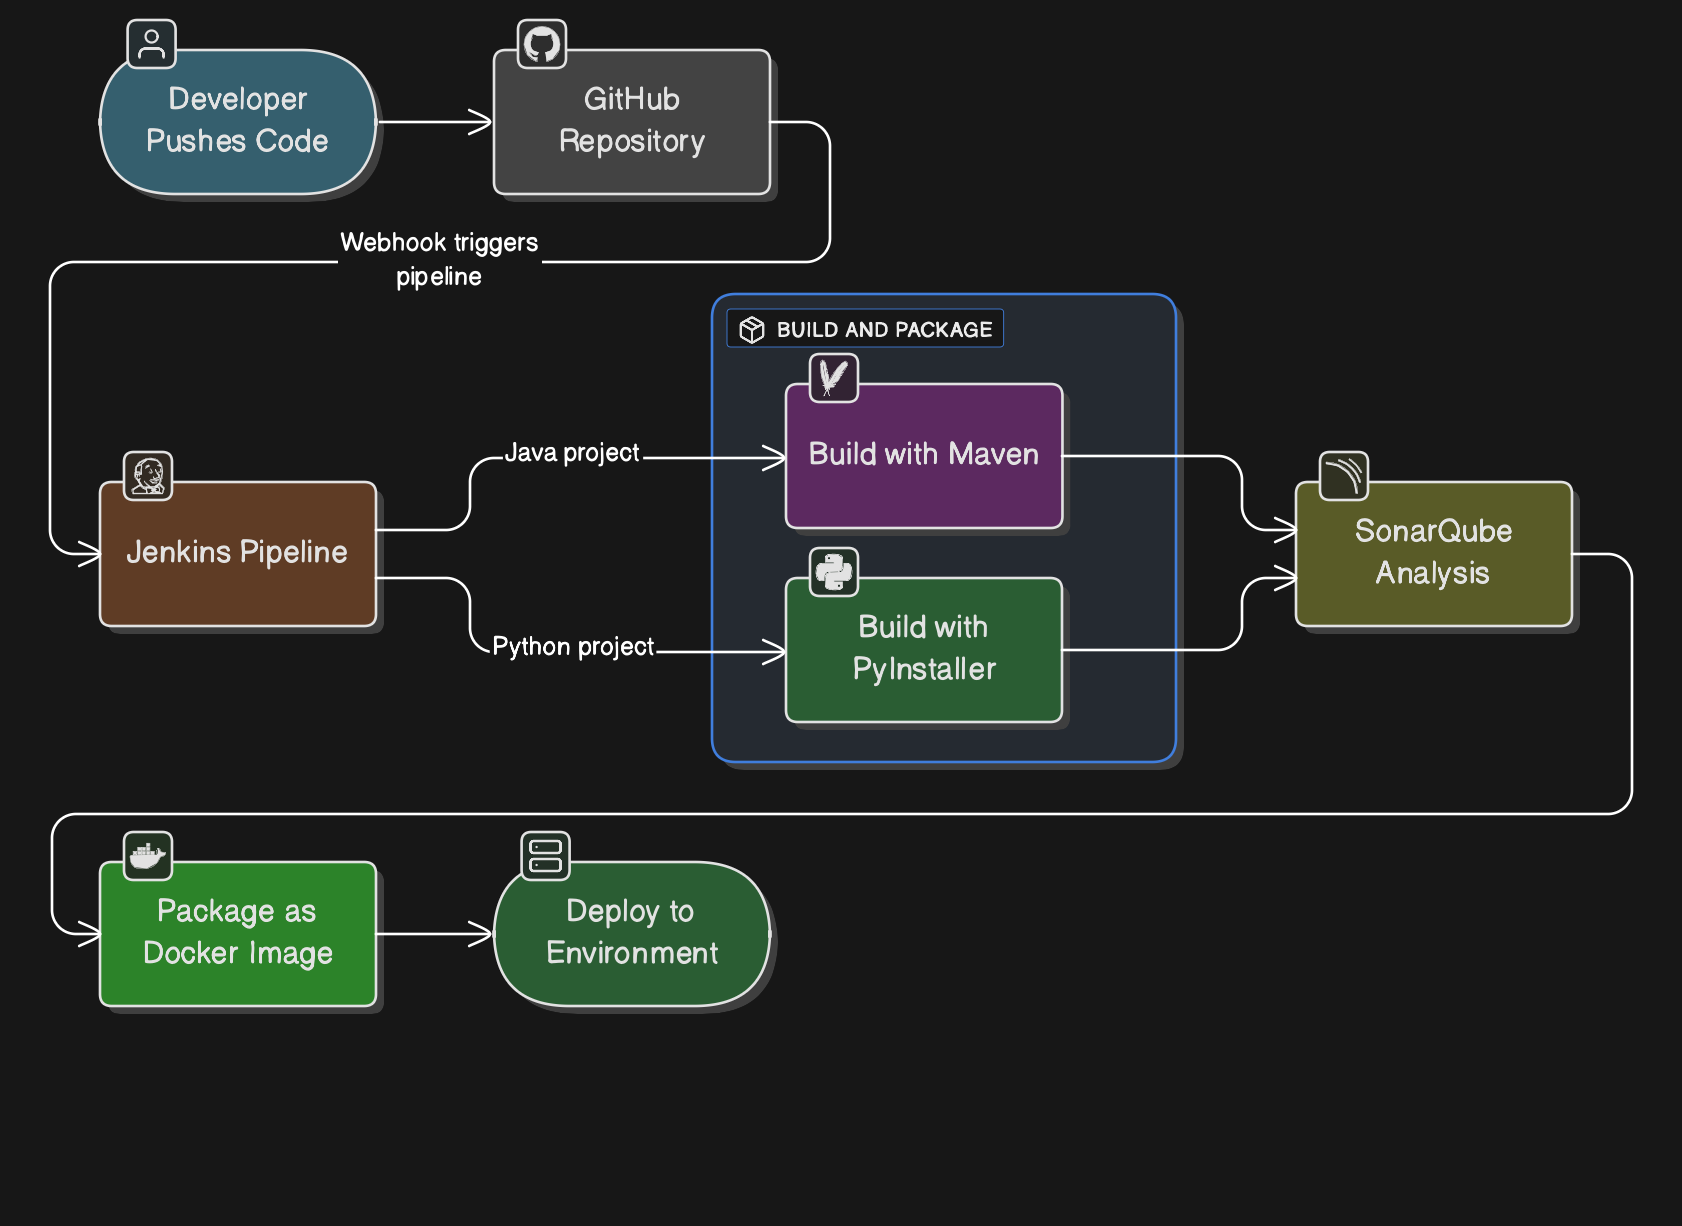
Full-stack serverless app on EC2, Lambda, S3, and API Gateway with Cognito authentication and Step Functions automation that cut manual triggers by 30%. Separately, a Jenkins pipeline with SonarQube quality gates and Docker deployment.

Serverless application architecture
Serverless architecture
Jenkins CI/CD pipeline
CI/CD pipeline
contact

Want the code walkthrough?

Happy to screen-share any of these and talk through what broke.